| Issue |
A&A
Volume 701, September 2025
|
|
|---|---|---|
| Article Number | A202 | |
| Number of page(s) | 16 | |
| Section | Catalogs and data | |
| DOI | https://doi.org/10.1051/0004-6361/202554224 | |
| Published online | 17 September 2025 | |
Error dependencies in the space-based CNEOS fireball database
1
Department of Aerospace Science and Technology, Politecnico di Milano,
Via La Masa 34,
20156
Milano,
Italy
2
Instituto de Astrofísica de Canarias,
Vía Láctea S/N,
38205
La Laguna,
Tenerife,
Spain
3
Departamento de Astrofísica, Universidad de La Laguna,
38205
La Laguna,
Tenerife,
Spain
4
NSF Astronomy and Astrophysics Postdoctoral Fellow
5
Department of Physics and Astronomy, Michigan State University,
East Lansing,
MI
48824,
USA
★ Corresponding author: This email address is being protected from spambots. You need JavaScript enabled to view it.
; This email address is being protected from spambots. You need JavaScript enabled to view it.
Received:
21
February
2025
Accepted:
31
July
2025
Abstract
Context. The CNEOS database offers near-global coverage of fireball events based on U.S. Government sensor detections. The database contributes to investigations of meteoroid impact fluxes. However, the accuracy of these data is not reported.
Aims. We aim to evaluate the reliability of CNEOS-derived ephemerides of fireball events given the absence of the underlying data. In particular, we identify conditions leading to larger or smaller orbital uncertainties and analyze the self-consistency of velocity vectors as a proxy for errors.
Methods. We analyzed 18 events that have both (i) sufficient satellite information to derive orbits and (ii) ground-based observational counterparts. Specifically, we quantified the uncertainties on these “calibrated events” using the orbital similarity metric, DD. We also examined the geocentric velocity components imbalance at the population level and identified discriminants that can indicate the accuracy of a given event.
Results. We identified two distinct groups in the CNEOS database. CNEOS data produces ephemeris determinations with DD < 0.1 for fireballs reported either (i) after late 2017 or (ii) with impact energies above 0.45 kt, with 74–78% of events having DD=0.03 ± 0.02 and ∼11% showing DD < 0.008. Our statistical test confirms these two parameters as the only reliable discriminants that, when combined, explain the two accuracy groups. Daylight, the z-velocity component, low altitude, duration, and latitude might also indicate errors, although the limited dataset may obscure correlations. No clear discriminants are identified for more restrictive DD cutoffs. We provide estimates of orbital uncertainties for calibrated events. The hyperbolic fireball subset in the CNEOS database appears as an outlier in the velocity imbalance test.
Conclusions. Our results confirm that the fidelity of CNEOS fireball data improved significantly from 2018, likely due to the deployment of next-generation space sensors, and show a growing number of high-velocity events. Hyperbolic candidates should be interpreted with caution, as their velocities and inclinations likely reflect measurement errors. Accuracy constraints remain limited by the dataset size, as is evidenced by the lack of statistically significant dependence on duration, preventing strong conclusions from being drawn.
Key words: meteorites / meteors / meteoroids
© The Authors 2025
 Open Access article, published by EDP Sciences, under the terms of the Creative Commons Attribution License (https://creativecommons.org/licenses/by/4.0), which permits unrestricted use, distribution, and reproduction in any medium, provided the original work is properly cited.
This article is published in open access under the Subscribe to Open model. This email address is being protected from spambots. You need JavaScript enabled to view it. to support open access publication.
1 Introduction
The database of bright fireball events hosted by the Center for Near-Earth Object Studies (CNEOS)1 is derived from observations made by U.S. Goverment (USG) space-based sensors. These sensors include classified spy satellites originally developed under the framework of the Treaty on the Non-Proliferation (Tagliaferri et al. 1994). These satellites were designed to monitor nuclear explosions and therefore provide near-global coverage of the Earth (60-80%) (Brown et al. 2002). As a byproduct of their operations, the USG sensors detect fireballs in the silicon bandpass. This is in stark contrast to typical ground-based, fireball-monitoring networks, which are limited to surveying small atmospheric volumes. For instance, the European Fireball Network (EN) monitors only 0.14% of the Earth’s surface (Borovička et al. 2022b). However, the specifics of the USG space-based instruments, including their sensitivity, data processing pipelines, and measurement uncertainties, are not publicly disclosed by CNEOS. Consequently, while the CNEOS dataset is invaluable for providing broad statistical insights into the frequency and characteristics of meter-sized impactors (Brown et al. 2002; Borovička & Charvát 2009; Brown et al. 2013; Farnocchia et al. 2017; Palotai et al. 2019; Peña-Asensio et al. 2022; Chow & Brown 2025), the lack of transparency regarding the instrumentation and data calibration inhibits its utility for high-precision analyses of individual targets.
The first step in studying fireballs is to determine their apparent radiant and velocity at the beginning of the atmospheric flight, which are then used to compute the heliocentric orbit. The apparent radiant is defined as the unit vector parallel to the fireball’s trajectory as it enters Earth’s atmosphere, but with the opposite sign. An accurate assessment of the radiant and initial velocity has been repeatedly demonstrated to be critical for understanding the origin of any given impactor (Egal et al. 2017; Hajduková et al. 2019; Hajduková & Kornoš 2020; Hajdukova et al. 2020; Vida et al. 2020).
Several studies have examined the reliability of the CNEOS fireball data, yielding mixed conclusions. Devillepoix et al. (2019) compared ten fireballs in the CNEOS database that had independent measurements and state that they are generally unreliable for orbit calculations. Devillepoix et al. (2019) identified extreme deviations in USG estimates compared to ground-based values: 28% in velocity for the Romania and Buzzard Coulee events, and up to 90 degrees in radiant for the Buzzard Coulee and Crawford Bay events. Peña-Asensio et al. (2022) later identified a typographical error in the 2008 TC3 fireball data, the correction of which led to a substantial improvement in the agreement for that specific event. Peña-Asensio et al. (2024b) concluded, after comparing 17 events with independent ground-based measurements, that approximately 65% of CNEOS fireball measurements are in relative agreement with ground-based observations. Brown & Borovička (2023) reported that radiant position errors frequently exceeded 10° for the same 17 events. They also extrapolated velocity uncertainties of up to 10–15 km/s for high-speed events, based on the assumption that velocity uncertainty positively correlates with speed. Finally, using a statistical approach, CNEOS data were found to be insufficiently accurate for Hajduková et al. (2024) to determine the fireball’s origin. USG energy measurements of fireballs align within a factor of two for well-documented events observed by GOES satellites (Wisniewski et al. 2024).
In this work, we present a comparative analysis of the orbital elements for the 18 CNEOS events with independent ground-based measurements to better constrain the associated uncertainties. These are the only 18 fireball events to date that have independently determined orbits among the 329 fireballs with velocity vector information in the CNEOS database (1007 in total). We adopt the well-established and standard ecliptic J2000 reference frame in order to ensure consistency in our comparisons. This choice reduces potential errors as the literature exhibits inconsistencies in parameter conventions, with multiple definitions often used for the same quantities. For example, some authors do not define azimuth with zero to the north. Velocity may be reported as the corrected pre-atmospheric value, at the onset of the luminous phase, at the fireball’s energy peak, or as an average over its atmospheric flight. Similarly, the atmospheric entry angle is referenced to both the local horizontal and the zenith.
The subset of CNEOS calibrated events has been observed in prior work to comprise two distinct populations based on their errors. Around three quarters of the events exhibit lower DD values, while the remaining group has significantly larger DD. We performed statistical tests on this set to identify conditions associated with better or worse measurements; we refer to these conditions as discriminants for the remainder of this paper. For example, impact velocity has been widely regarded in the literature as a discriminant because higher-velocity events tend to have larger measurement errors (Brown & Borovička 2023; Desch & Jackson 2023; Fernando et al. 2024; Hajduková et al. 2024). Although this assumption is valid for ground-based observations and likely applicable to space-based systems, it seems not to be supported by the current CNEOS database (Socas-Navarro 2024). To refine these insights, we systematically tested all parameters reported in the CNEOS database to identify relationships that explain discrepancies between lowand high-DD measurements. Hereinafter, we use the terms low-DD and high-DD purely for comparison between the two groups — equivalent to referring to lower and higher DD values. This approach aims to help researchers assess the reliability of events in the database, particularly in cases in which ground-based observations are unavailable.
Additionally, we investigate the reliability of hyperbolic events reported in the CNEOS database based on a velocity component balance analysis. The velocity vectors of Earth impactors are typically described in a geocentric reference coordinate system. The distribution of approach directions of fireballs is random and therefore geocentric fireball velocity components should exhibit a Gaussian distribution. Therefore, there should not be a preferred direction in geocentric fireball velocity components. The orbit of an impactor with one velocity component significantly higher than its other two would have to align precisely with that randomly chosen axis (Hajduková et al. 2024). While such alignments can occur by chance for isolated events, it is suspicious if they appear repeatedly within a particular group of measurements. For this reason, consistent imbalances in the velocity components along different axes indicate potential measurement errors.
This paper is organized as follows. In Section 2, we outline the methodology for determining heliocentric orbits using data from the CNEOS database, and introduce the DD criterion as a measure of orbital similarity and describe its application to CNEOS data. In Section 3, we present our comparative analysis of calibrated fireballs and determine effective discriminants to distinguish between low- and high-DD events. In Section 4, we introduce a statistical test to analyze the self-consistency of the velocity vectors. In Section 5, we assess the reliability of hyperbolic fireballs in the CNEOS database. Finally, in Section 6 we summarize our findings and discuss their implications for the study of fireballs and potential interstellar impactors.
2 Orbit determination and error quantification
We are primarily motivated to identify conditions under which the observations reported in the CNEOS database exhibit reliable uncertainties. It appears that CNEOS events fall into two distinct subsets: fireballs with larger and smaller uncertainties. In order to quantify the orbital errors, we determine the orbits (Sect. 2.1) and implement an objective criterion that is commonly used to determine meteor associations or, equivalently, orbit similarities (Sect. 2.2).
2.1 Computing ephemerides of fireballs from CNEOS data
In this subsection, we describe our methodology to determine heliocentric orbital elements based on the data provided by CNEOS. We first calculate the apparent radiant using the impact velocity vector, V. This vector is defined in the Earth-centered, Earth-fixed (ECEF) coordinate system by CNEOS. In this coordinate system, the z axis aligns with the Earth’s rotation axis toward the celestial north pole, the x axis lies in the equatorial plane toward the prime meridian, and the y axis completes the right-handed system. This frame is amenable to the straightforward calculation of parameters that characterize an impactor’s motion relative to the surface of the Earth. Examples of these parameters are the atmospheric entry angle (relative to the local horizontal) and azimuth (measured clockwise from true north).
The apparent atmospheric entry direction was calculated with two successive linear transformations applied to V= [Vx, Vy, Vz]T, which allowed us to compute the local azimuth and elevation (often called slope). The initial transformation is a clockwise (negative) rotation within the xy plane by an angle, λe, defining the longitude at maximal fireball energy2. The next linear transformation is a clockwise (negative) rotation in the xz plane by the colatitude, defined as θe=90°−ϕe, where ϕe is the energy peak latitude. These two transformations in the above order provide the velocity vector in local coordinates:
![Mathematical equation: $\mathbf{V}_{\mathbf{e}}=\left[\begin{array}{ccc} \cos \left(-\theta_{e}\right) & 0 & \sin \left(-\theta_{e}\right)\\ 0 & 1 & 0 \\ - \sin \left(-\theta_{e}\right) & 0 & \cos \left(-\theta_{e}\right) \end{array}\right] \cdot\left[\begin{array}{ccc} \cos \left(-\lambda_{e}\right) & - \sin \left(-\lambda_{e}\right) & 0 \\ \sin \left(-\lambda_{e}\right) & \cos \left(-\lambda_{e}\right) & 0 \\ 0 & 0 & 1 \end{array}\right] \cdot\left[\begin{array}{c} V_{x} \\ V_{y} \\ V_{z}\end{array}\right].$](/articles/aa/full_html/2025/09/aa54224-25/aa54224-25-eq1.png) (1)
(1)
In Eq. (1), the first and second matrices denote the standard rotation matrices about the z axis and y axis by angles θe and λe, respectively. We next calculate the heliocentric orbit of the impactor using the CNEOS provided pre-atmospheric velocity vector, which is then corrected for Earth’s rotation and gravitational effects through the zenith attraction method (Whipple & Jacchia 1957; Ceplecha 1987). The implementation of this methodology is similar to Peña-Asensio et al. (2022) and is described with more details in Peña-Asensio et al. (2021). We calculated the ecliptic osculating heliocentric orbital elements by considering the Earth’s precise position and distance relative to the Sun. Specifically we calculated the inclination (i), eccentricity (e), longitude of the ascending node (Ω), perihelion distance (q), and argument of perihelion (ω). These parameters provide utility because they (i) characterize individual trajectories and (ii) enable comparative analyses and specifically identification of potential relationships between individual trajectories.
2.2 Orbital dissimilarity as a proposed criterion for error quantification
In this section, we describe the methodology used to quantify the uncertainties in the CNEOS database. Specifically, we examine fireballs that have been independently observed by ground-based cameras. The orbits provided by these measurements are assumed to be the ground truth.
We implemented an orbital similarity metric to assess the accuracy of the CNEOS data. Early efforts to quantify the similarity between heliocentric paths of fireball trajectories introduced what is now known as the D-criterion. The first of these metrics — introduced by Southworth & Hawkins (1963) — is the DS H criterion which measures orbital dissimilarity. Subsequent advancements refined these criteria to enhance their discriminative power. For instance, Drummond (1981) introduced the DD criterion as a modification to the DS H metric. DD incorporates normalized weights for eccentricity and perihelion distance in order to ensure that all terms contribute proportionally to the overall measure. This formulation also incorporates the angle between perihelion points (θBA), defined as the combined contribution of ecliptic longitude and latitude, and the angle between the inclinations of the orbits (IAB). The metric is defined as
 (2)
(2)
In Equation (2), subscripts A and B denote the two orbits that are being compared.
The DD metric has been widely used to evaluate orbital similarity, particularly in studies linking meteors to (i) meteor showers or (ii) their parent bodies (McIntosh 1990; Spurný et al. 2003; Williams et al. 2004; Wiegert & Brown 2005; Rożek et al. 2011; Abedin et al. 2015; Olech et al. 2016; de la Fuente Marcos & de la Fuente Marcos 2018b,a; Moskovitz et al. 2019; Di Mare et al. 2019; Spurný et al. 2020; Janches et al. 2020; Sergienko et al. 2020b,a; Andrade et al. 2023; Koten et al. 2023; Peña-Asensio et al. 2023, 2024b, a; Humpage & Christou 2024; Shober & Vaubaillon 2024). The DD involves selecting a threshold or cutoff to balance the certainty of accepting or rejecting association hypotheses, minimizing both false positives and missed detections. Drummond (1981) originally proposed a threshold of DD=0.105 to determine whether two orbits are sufficiently similar to suggest a common origin. However, various authors have employed different thresholds over time that we itemize in Table 1. We emphasize that these thresholds were not designed for pairwise orbit comparison (as we are doing here), but rather for evaluating the statistical likelihood of association against a background population.
DD thresholds applied in various literature studies to assess the similarity of meteoroid stream member orbits.
In this study, we use the DD criterion to quantify uncertainties in orbital determinations derived from CNEOS data. The CNEOS-derived orbits are compared with independently calculated ground-based orbits, the latter of which are assumed to be accurate. In the remainder of this manuscript we refer to these 18 events with ground-based counterparts as calibrated fireballs. The DD values for each calibrated fireball enable determination of whether the discrepancy between CNEOS and ground-based data falls below established statistical cutoffs, offering an indicator of the goodness of the observation.
The determination of appropriate DD thresholds has been extensively refined to account for factors beyond a fixed value. Neslušan et al. (1995) introduced the importance of adjusting this threshold based on the background distribution in the specific phase space of each meteoroid stream. For instance, Jopek & Froeschle (1997) emphasized that appropriate thresholds should depend on the size of the dataset considered; for example, larger datasets may necessitate stricter orbital-similarity criteria to reduce false positives. Galligan (2001) proposed inclination-dependent thresholds: specifically DD=0.06 for i < 10°, DD= 0.11 for 10° < i < 90°, and DD=0.18 for i>90° (retrograde). Near-ecliptic orbits, due to their higher meteoroid density and reduced differentiation by inclination, require lower thresholds to limit contamination by sporadic meteors. Additionally, Moorhead (2016) argued that the threshold should be adapted based on the relative meteor shower and sporadic background magnitudes in order to (i) ensure sensitivity and (ii) minimize contamination.
Physical properties of 18 orbit-calibrated fireballs reported in the CNEOS database.
Jopek & Bronikowska (2017) proposed a statistical approach to define similarity thresholds between orbits based on a proof-of-concept implementation on synthetic data. Their Eq. (16) yields a cutoff value of ∼0.008 for a sample size of 800, indicating that two orbits below this threshold can be considered members of the same meteor shower with 99% confidence. We aim to use the DD criterion as a metric to assess the observational quality of a fireball, which is distinct from their methodology. Applying their Eq. (16) to a sample size of 2 would yield a cutoff of 0.092. However, this value lies well outside the empirical range for which the formula was calibrated.
We use a cutoff value of 0.1 as a qualitative boundary proxy between low- and high-DD fireballs. Indeed, our discriminant analysis (Sect. 3.2) shows that, 0.1 is the only threshold that yields statistically significant separation between orbits, while also producing physically meaningful groupings. We note that 0.1 is adopted only for the uncertainty-matching experiment and is not proposed as a general search limit. Furthermore, our approach does not aim to classify orbits as “good” or “bad” in an absolute sense. Instead, we quantify the typical dissimilarity with respect to independently measured reference events using the DD metric. The thresholds applied (0.008, 0.05, and 0.1) serve only as heuristic values to assess how the dataset partitions into subsets of lower and higher dissimilarity, with the latter reflecting larger uncertainties in the derived orbits.
3 Ground-based sensor measurements versus USG ones
In this section, we evaluate the consistency between ground-based observations and USG sensor measurements, focusing on orbital elements (Sect. 3.1), while in Section 3.2, we statistically identify discriminants that can indicate the accuracy of a given event. We compare the orbits of 18 calibrated fireballs using data from the CNEOS database alongside corresponding ground-based measurements. We aim to (i) evaluate the consistency between these two sources and (ii) identify thresholds that distinguish between higher and lower reliability in orbit determination.
3.1 Comparing orbits
In Table 2, we summarize data from the CNEOS database for the 18 orbit-calibrated fireballs. In Table 3 we show the orbital elements for each fireball both (i) calculated here with CNEOS data (using the methodology outlined in Section 2.1) and (ii) derived from ground-based measurements with the corresponding references. The Crawford Bay fireball (2017-09-05 05:11:27) was excluded from the analysis due to insufficient data, as its information is limited to a conference abstract and lacks a determined orbit (Hildebrand et al. 2018).
We also report the DD value between CNEOS-derived and ground-based orbits for each calibrated fireball calculated using Equation (2) in Table 3. High-DD orbits are observed for fireballs recorded (i) before mid-2015 or mid-2017 and (ii) with total impact energies below 0.41–0.44 kt (see Figure A.1 in the appendix). In the remainder of this paper we use these cutoffs and the DD=0.1 threshold to refer to high-DD versus low-DD as a proxy of the measurement errors (see below for numerical values). The energy and year thresholds are defined by the transition boundaries, with the first value corresponding to the last event meeting the conditions and the second to the first event that does not.
Motivated by this stronger dependence of DD on time and impact energy, we systematically identify energies and fireball occurrence years that produce low- or high-DD. In Figure 1, we highlight regions of impact energy-year parameter space where high-DD orbits occur. This region is defined by two possible boundaries for both year and energy, resulting in four possible combinations. These boundaries correspond to: (i) the last event satisfying the DD < 0.1 and (ii) the first event that does not satisfy this condition. Based on these thresholds, high-DD orbits are observed for fireballs recorded (i) before mid-2015 or mid2017 and (ii) with total impact energies below 0.41 or 0.44 kt.
Heliocentric orbital elements in the ecliptic J2000 reference frame of calibrated fireballs.
Events with DD between these two thresholds (0.05 < DD < 0.1) are defined as "doubtful." In other words, the classification of these intermediate events as low- or high-DD is sensitive to the cutoff choice. The most doubtful event is 2022 EB5 (DD=0.072), exhibiting the highest energy peak latitude value (70.0°) among all fireballs analyzed (Table 2). 2019 MO is also classified as doubtful with a DD=0.060. However, its proximity to the lower end of established thresholds (see Table 1) implies it may still represent a reasonably reliable orbit determination. It is worth noting the ∼168° and ∼180° differences in the argument of perihelion and the longitude of the ascending node, respectively, for the event 2019 MO (see Table 3). Due to the orbit’s low inclination, these angular shifts combine geometrically in a way that preserves the spatial orientation of the orbit, thus having a limited effect on the DD value.
The Crawford Bay event (not in the calibrated subset) occurred in September 2017 with a total impact energy of 0.13 kt; both characteristics are consistent with the thresholds for high-DD orbits. However, the heliocentric orbit of this event is not documented in the literature. Its impact energy falls well below the 0.41–0.44 kt threshold for reliable orbits, and its timing aligns with the mid-2017 cutoff. The event’s significant offset in radiant position, reported as 92° by Brown & Borovička (2023), reinforces its classification as a high-DD measurement.
We observe small discrepancies in the reported times of several CNEOS calibrated events when compared to prior studies. For instance, the Buzzard Coulee, Košice, Chelyabinsk, and Kalabity fireballs show differences of 4, 3, 12, and 8 seconds, respectively, relative to the data provided by Brown & Borovička (2023); Peña-Asensio et al. (2024b). These discrepancies are likely due to updates made to the CNEOS database, which appears to have been revised in 20243. We identified no other typos in the sign of the velocity components in any of the CNEOS events besides from 2008 TC3 (Peña-Asensio et al. 2022).
Updates to the CNEOS database such as the one in 2024 may reflect broad improvements in the accuracy of CNEOS data. As noted by Chow & Brown (2025), USG events measured after 2018 exhibit reduced differences in radiant and velocity measurements compared to earlier data. This is consistent with our findings: CNEOS data yield orbits with lower DD values after late 2017 or for energies larger than 0.45 kt. With an average DD=0.03 ± 0.02, 78% of the events (74% including the Crawford Bay fireball) have orbits with DD below 0.1. Using a stricter cutoff of DD < 0.05, 67% (63% considering the Crawford Bay fireball) of CNEOS events would have low-DD orbits, with a mean DD value of 0.03 ± 0.01. Using a more restrictive cutoff of DD < 0.008, 11.1% of the events would have low-DD(10.5% if Crawford Bay fireball is considered).
Table 4 summarizes the median DD values and orbital element uncertainties (with standard deviations) for groups classified as having low- and high-DD orbits, along with the impact velocity and right ascension (αg) and declination (δg) of the geocentric radiant. These uncertainties can serve as reference values for studying CNEOS fireballs when no additional information is available, based on the year of occurrence and the total impact energy. The larger uncertainty in the longitude of the ascending node for the low-DD group arises from the interplay with the argument of perihelion for the near-ecliptic 2019 MO impactor (see Table 3). As a reference, we report the overall statistics of the DD values computed for the 17 CNEOS-reference orbit pairs: the median is 0.04, the mean is 0.13, and the standard deviation is 0.24. The difference between the mean and median, along with the high dispersion, indicates a non-Gaussian distribution and supports the presence of two distinct subsets within the sample.
Median and (upper and lower) 1 σ standard deviations of the DD values and orbital element, velocity, and geocentric radiant errors for the 18 calibrated fireballs from CNEOS.
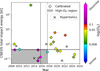 |
Fig. 1 Total impact energy provided by CNEOS as a function fireball year. Hyperbolic and calibrated (with independently determined orbits from ground-based observations) events are indicated with diamonds and crosses, respectively. The color of calibrated event markers corresponds to the DD value between CNEOS-derived and ground-based orbits. Selected DD thresholds are indicated by a dotted line on the colorbar, delimiting each sub-colormap segment. The gray area highlights the parameter space that results in high-DD orbits for the calibrated events (based on the criteria DD < 0.1). Two vertical and two horizontal dashed lines define the possible boundaries of the high-DD orbit region. 2008 TC3 has been sign-corrected following Peña-Asensio et al. (2022). |
3.2 Discriminants
It is evident from the previous subsection that a correlation may exist between orbital accuracy and fireball date and energy. There are two straightforward physical interpretations of this: (i) the satellite network was significantly improved after 2017 and (ii) brighter fireballs (higher impact energy) should be more easily detected and tracked by the sensors, regardless of the (undisclosed) technology employed. In this section we apply a statistical test to quantify the fidelity with which these discriminants provide predictive power. We then use this method to investigate the utility that the remaining CNEOS parameters present as discriminants.
The fireballs registered in the CNEOS database constitute a series of independent events. Therefore, the accuracy of any given event in the database should be independent of the remaining events. The identification of a fireball event as low-DD or high-DD is therefore a Bernoulli experiment. A series of events may be seen as a Poisson process. We investigate the hypothesis that high-DD events are clustered below or above an event date threshold value, T. All high-DD events occur before 2018 as demonstrated in Figure 2 (upper left). Therefore define the threshold of T greater than T = 2017.49 yr as the value that separates the low-DD and high-DD groups while also maximizing the number of events in the good group.
In order to make any claim about the possibility that the event date may be considered a discriminant parameter with threshold T, we need to quantify the probability of the null hypothesis. In our case, the null hypothesis is the assumption that the series of consecutive, low-DD events recorded after the threshold is obtained by chance. The solid blue line in Figure 2 provides an initial indication of each variable’s effectiveness as a discriminant, with a higher probability corresponding to a greater number of events in the light blue filled region.
In a Poisson process, the probability that a series of n consecutive, low-DD measurements occur by chance is given by pB=(pB, low)n, where pB, low is the overall probability that a given event belongs to the low-DD group. In our case, the expected value of pB, low is 14/18. Applying this formula to the series of consecutive low-DD measurements after T=2017.49 yr gives us the resulting probability for the null hypothesis of 0.06. This low value suggests that the date may be a predictive discriminant with threshold T = 2017.49 yr, although not with 95% confidence. Fireballs registered in the database after that date are most likely in the low-DD group and have their parameters with sufficiently precision to provide an orbit determination with DD < 0.1.
Figures 1 and 2 suggest that the impactor energy might be another predictive discriminant. The statistical test described above provides a low pB=0.1 probability for the corresponding energy null hypothesis (T=0.44 kt). Latitude and altitude might also be valid discriminants, although the null hypothesis is not so confidently rejected for these parameters (pB=0.28 for T=22.5° and pB=0.17 for T=27 km, respectively). While these pB values are not conclusive, there are physical reasons why one would expect that these correlations might exist. USG sensors in geostationary orbit have a favorable observing geometry for detecting events near the equator. Moreover, fireballs impacting at lower altitudes should have lower detection errors because they typically reach further atmospheric depths and have longer observable arcs.
For the longitude parameter, the minimum and maximum values correspond to high-DD events, so pB=1. It is surprising that velocity is clearly non-discriminant parameter with a pB=0.78 for T=40.4 km/s. While some of the highest DD values are associated with low velocities, numerous lowvelocity events also exhibit low DD values. Additionally, the fastest calibrated fireball – the Iberian superbolide – is well aligned with ground-based observations (Peña-Asensio et al. 2024), consistent with the findings of Socas-Navarro (2024), although a single case does not necessarily validate a broader trend. However, the Iberian superbolide was long-lasting, with a near-grazing atmospheric entry angle that likely exceptionally enhanced its observability. The x — and y-velocity components are also non-discriminant parameters. We find a surprising low pB value for the Vz velocity component (pB=0.08) with threshold T=−2.4 km/s. We have not identified an explanation for the correlation between DD and the sign of Vz.
We also considered the possibility that local daytime could be a discriminant because the orbits of daytime fireballs are presumably more difficult to accurately measure. The center panel in Figure 2 shows the distribution of events as a function of a daylight parameter, which varies linearly local nighttime to local daytime. Contrary to our expectation, the high-DD group appears clustered in the local nighttime (pB=0.13 for the threshold just before noon). We also tested two parameters that are not provided by CNEOS but we expect to strongly affect the quality of the observations. Neither the atmospheric entry angle relative to the local horizon (pB=0.37 for T=72°) nor the fireball duration (pB=0.22 for T=11.5 s) rejected the null hypothesis with sufficient confidence, although the latter yielded a relatively low pB value (∼80% of confidence). This suggests that, while these parameters — particularly the duration — are physically meaningful and likely relevant, the current sample size may be insufficient to draw strong conclusions.
For completeness, we repeated the Bernoulli experiment using stricter DD thresholds of 0.05 and 0.008, effectively redefining the criteria for high- and low-DD cases. With a cutoff at DD < 0.05, none of the discriminants rejected the null hypothesis. The most significant is Vz, with a pB=0.06, followed by entry angle and altitude (the two of them with pB=0.20). Only two events satisfied the condition for the more restrictive cutoff at DD < 0.008. This precludes the identification of any discriminant because neither event lies close to the other or near the extremes of any parameter distribution (Figure 2). Table 5 compiles the pB values and their corresponding threshold for the parameter tested as discriminants.
Our analysis concludes that year and energy are effective discriminants and, when combined, are the only factors that can accurately classify the low-DD group of all calibrated events. We identified other parameters with suggestive results but lack an intuitive explanation for their significance. We also note that the 2010 Košice and mid-2017 Baird Bay fireballs exhibit the lowest DD values among all calibrated events. No explanation for this anomaly is evident in the current dataset (see Figure 2). The small sample size of calibrated events hinders our ability to provide more conclusive results. As more events are recorded simultaneously by the satellite sensors and ground-based facilities, the number of calibrated bolides will increase and the statistical test will become more reliable. For now, we consider the date and energy as good discriminants, although altitude, latitude, Vz, and daylight warrant further investigations.
pB values for different parameters tested as discriminants, under different significance thresholds for three different DD thresholds.
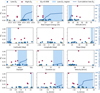 |
Fig. 2 Discriminants identified with the statistical test. First-row panels: date (left), energy (center), and altitude (right). Second-row panels: absolute latitude (left), longitude (center), atmospheric entry angle (right). Third-row panels: Daylight (left), duration (center), and velocity (right). Fourth-row panels: x-velocity component (left), y-velocity component (center), and z-velocity component (right). The filled light blue region represents consecutive low-DD events, while the solid line depicts their cumulative percentage, offering a visual indication of the discriminant’s effectiveness. Fireballs flagged as low-DD(DD < 0.1) are denoted by blue squares and high-DD(DD > 0.1) with red circles. Fireballs with DD < 0.008 have a yellow plus symbol. |
4 Analyzing self-consistency of velocity components
We implemented a methodology to quantify potential differences between subsets of fireballs with the distribution of velocity components inspired by the reasoning described in Section 4.2 of Hajduková et al. (2024). Impacts should occur randomly in the geocentric reference frame, thereby producing Gaussian distributions of each individual velocity component. Our methodology hinges on the fact that it is statistically unlikely for any subset distribution to consistently exhibit events with excess in one velocity component. For this same reasoning Hajduková et al. (2024) stated that the velocity component outlier events in the CNEOS database are caused by measurement errors along one axis4. We introduced a score metric, Score(V), which quantifies the deviation of the individual velocity components from the magnitude of the velocity vector, rather than assessing whether any individual component is extreme relative to the overall population. This metric should determine whether subsets of fireballs exhibit distinctive velocity characteristics. In other words, Score(V) encapsulates how (un)balanced the velocity components are relative to the total velocity and is defined as
 (3)
(3)
In Equation (3), V=(Vx, Vy, Vz)T represents the velocity vector and ∥V∥ represents its magnitude. Velocity vectors with high Score(V) have larger imbalances in their components. In other words, any outliers in this metric will exhibit an anomalous excess difference between the values of their components. Hajduková et al. (2024) focused on events with extreme component values relative to the overall population. Our approach is distinct and complementary; we evaluate internal imbalance within each individual event, which does not necessarily imply globally extreme values. Our hypothesis is that this imbalance is caused by measurement errors. To clarify, a randomly chosen subset of events is expected to reflect the population mean. There is no reason for any randomly chosen subset of vectors to all have high Score(V) relative to the overall database regardless of their physical nature.
We next calculated the average score for the subset and compare it to a reference distribution generated through bootstrapping. Bootstrapping is a statistical method that involves generating multiple resampled subsets by randomly drawing data from the original database. This step serves to evaluate whether a subset of fireballs deviates significantly from the population in terms of relative excess in its velocity components. The observed statistic, Sobs, is defined as the mean score across all fireballs in the subset:
![Mathematical equation: $S_{\mathrm{obs}}=\frac{1}{N}\left[\sum_{n=1}^{N} \operatorname{Score}\left(\mathbf{V}_{n}\right)\right].$](/articles/aa/full_html/2025/09/aa54224-25/aa54224-25-eq23.png) (4)
(4)
In Equation (4), N is the number of events in the subset. The number of bootstrapping iterations of random sampling, nboot=10000, are performed to construct the reference distribution. The total number of velocity vectors, N, are sampled without replacement (excluding the subset being evaluated) from the population in each iteration. The mean score for each subset is computed, which produces a distribution of bootstrap statistics  . The p value is then calculated as the fraction of bootstrap samples where the mean score,
  , is greater than or equal to Sobs:
 (5)
(5)
where the indicator function  equals 1 if
  and 0 otherwise.
The assumed null hypothesis is that any randomly drawn subset of velocity vectors should not have an abundance of individual velocity vectors with significant differences between the three components. In other words, a randomly drawn velocity vector should have a low probability of being aligned with one of the (arbitrary) reference coordinate directions. The p value calculated in Equation (5) represents the likelihood that a subset of vectors would have such anomalous differences. A p value of 1 indicates that the subset’s mean score (Sobs) shows no excess between velocity components. In contrast, a p value near 0 suggests the subset exhibits significant anomalies, enabling the null hypothesis to be rejected. Typically, a p value of p=0.05 implies 95% confidence that the deviation is meaningful and cannot be attributed to random variability.
We analyzed the individual velocity component distributions in order to evaluate the extent to which subsets of fireballs significantly deviate from the overall database. Specifically, we considered the two subsets of calibrated fireballs flagged as (i) low-DD and (ii) high-DD based on their orbits. The p values of the two subsets (calculated using Equation (5)) were (i) p value =0.54 and (ii) p value =0.74, respectively. The p value of the high-DD subset (ii) is indicative of insufficient statistical evidence to classify them as outliers. Similarly, the p value of the low-DD subset (i) provides no significant evidence of deviation. While the results do not support a strong statistical imbalance, the high-DD subset has more velocity component excess than the group with low-DD orbits.
Figure A.2 in the appendix represents the relationship between total velocity and its velocity components in a geocentric Earth-fixed reference frame within CNEOS database, as in Hajduková et al. (2024). In particular, only two events, the Romanian and Iberian fireballs, fall within the tail of the distributions. These two rank among the top 5% of the highest absolute values for any velocity component. However, only the Romanian event is associated with a poorly measured orbit.
It is important to note that measurement errors can cause deviations in velocity components that still align with the overall database distribution. These errors would produce balanced distributions that appear as having no excess according to our Score(V) metric (Eq. (3)). A random sample of events with errors following a normal distribution are unlikely to produce outlier imbalances because they tend to cluster around the mean. The 18 calibrated fireballs are effectively a random sample. Therefore, it is likely that they have the typical measurement errors; this is well represented by the p value obtained above. Moreover, some events may deviate from the distribution without necessarily being erroneous. Therefore, while the proposed test is valuable for identifying trends and highlighting potential outliers based on velocity component balance, it should not be relied upon as the sole indicator of orbital accuracy for individual fireballs.
5 Reliability of hyperbolic fireballs in CNEOS
A meteoroid bound to the Solar System typically enters Earth’s atmosphere at speeds between 11.2 km/s and 72 km/s. The lower limit corresponds to Earth’s escape velocity, and the upper limit reflects the sum of the Solar System’s escape velocity at Earth’s orbital distance (42 km/s) and a head-on encounter with Earth’s orbital velocity (30 km/s). If the meteoroid’s heliocentric velocity surpasses 42 km/s, it follows a hyperbolic orbit and may have an interstellar origin.
Scientists have been debating the existence and detections of interstellar meteors since the early 1900s. Fisher (1928) reported that nearly 80% of meteors in Von Niessl and Hoffmeister’s catalog (Von Niessl & Hoffmeister 1925) exhibited hyperbolic trajectories. This initiated a long-standing debate regarding the existence of interstellar meteoroids. This claim was systematically refuted by subsequent studies (Almond et al. 1951; Opik 1956; Jacchia & Whipple 1961; Štohl 1970; Hajduková 1993; Hajdukova 1994). The vast majority of these hyperbolic orbits result from measurement errors, with only a negligible fraction attributable to Solar System processes such as gravitational scattering by planets (Wiegert 2014).
Modern fireball databases like the EN catalog that are curated with state-of-the-art reduction techniques indicate that ∼2% of impacting meteoroids exhibit hyperbolic orbits within one standard deviation of their measurement uncertainties (Borovička et al. 2022a). Only two fireballs among these EN hyperbolic events retain hyperbolic classifications within threesigma confidence limits. The eccentricities in these cases are only marginally above unity (the maximum excess being of e=1.048).
Moreover, all but one EN hyperbolic meteoroid are in retrograde orbits. This predominance of retrograde orbits is particularly significant as illustrated in Figure 3. This retrograde bias has been attributed to the larger relative velocities of retrograde trajectories impacting Earth. These more likely impact head-on, with the higher relative velocities increasing the likelihood of measurement errors (Hajdukova et al. 2020). Interstellar objects should have kinematic distributions similar to stellar populations. The details of the expected kinematics and sky directions of interstellar objects are complex and depend on the underlying assumptions. For example, different underlying assumptions of the kinematic distributions have resulted in different expectations in terms of the expected distributions of orbital elements and numbers of detections (Engelhardt et al. 2017; Cook et al. 2016; Seligman & Laughlin 2018; Hoover et al. 2022; Marčeta 2023; Marčeta & Seligman 2023). However, in all of these cases the fraction of prograde to retrograde interstellar objects should be approximately ∼50:50 (see Figure 4 in Marčeta & Seligman 2023). Therefore, it is safe to say that if these meteoroids were part of a genuine interstellar population, their orbits would statistically show a 50: 50 distribution between prograde and retrograde motion. Of course, this is a general consideration about the overall population but it does not say anything about the possibility that any one of those events could be a genuine hyperbolic impactor among many false positives.
Hajduková et al. (2014) investigated the occurrence of hyperbolic meteoroids and concluded that only an extremely small fraction could credibly be of interstellar origin. They found that most hyperbolic orbits are better explained by inaccuracies in velocity measurements and that only a small fraction are attributable to Solar System perturbations. Building on this, Hajduková & Kornoš (2020) explored how measurement uncertainties impact the determination of meteoroid orbital parameters. Their work demonstrated that even minor errors in velocity or radiant position near the parabolic limit can artificially result in hyperbolic classifications. They emphasized the lack of robust evidence for truly interstellar meteoroids in current datasets.
The discovery of 1I/’Oumuamua in 2017, 2I/Borisov in 2019, and 3I/ATLAS in 2025 marked the first confirmed detections of macroscopic interstellar visitors to our Solar System (Williams et al. 2017; Borisov et al. 2019; Jewitt & Seligman 2023; Seligman & Moro-Martín 2022; Jewitt 2024; Fitzsimmons et al. 2024; Denneau et al. 2025; Seligman et al. 2025; de la Fuente Marcos et al. 2025). Spacecraft such as Ulysses and Galileo sampled dust particles traversing our Solar System in hyperbolic orbits, indicating a flux of smaller interstellar material Grün et al. (1993, 1997); Grün & Landgraf (2000); Landgraf et al. (2000). Radar detections of faint meteors with hyperbolic orbits have also been reported (Meisel et al. 2002; Weryk & Brown 2004; Baggaley 2000; Froncisz et al. 2020). Recently, two bright fireballs identified within the CNEOS space-based database have been highlighted as potential interstellar candidates (Siraj & Loeb 2022a,b; Peña-Asensio et al. 2022): fireballs that occurred on 2014-01-085 and 2017-03-09. These hyperbolic events have sparked great controversy, particularly regarding claims that remnants of the 2014-01-08 event were recovered from the ocean floor.
Table A.1 in the appendix presents the six hyperbolic fireballs identified in the CNEOS database. For each event, the table provides the date of peak brightness, latitude, impact energy (calculated from radiated energy), and the pre-impact velocity components in a geocentric Earth-fixed reference frame. The last two columns present the orbital eccentricity and inclination values as derived in this study.
Figure 1 shows these hyperbolic events within the context of the calibrated fireballs. 2014-01-08 17:05:34 and the event from 2015-02-17 13:19:50 are situated within the region identified as having high DD. The first one exhibits the highest orbital eccentricity among the hyperbolic fireballs, while the second has the lowest orbital inclination. It is worth noting that a high value of DD does not necessarily negate the hyperbolic orbit of a particular event, just as a low value of DD does not confirm the hyperbolic orbit. This is particularly relevant in the case of 2014-01-08 17:05:34 which would require either (i) much larger errors than those observed in the calibrated subset or (ii) very specific combinations of errors in velocity and radiant to turn its orbit into a bound one (Socas-Navarro 2024). We also highlight the unusually low energy of the 2021-05-06 05:54:27 event, which is substantially lower than the lowest energy among the calibrated fireballs considered with low-DD orbits.
Any genuine sample of interstellar fireballs should exhibit a broad range of geocentric speeds as the relative velocities of nearby stars range from 15 to 40 km/s, rather than being confined to exclusively high velocities (Hajduková et al. 2019; Marčeta 2023). Additionally, there is no physical reason for these fireballs to have significant disparities between their individual velocity components. In other words, the most probable distribution of interstellar objects would have a broad range of speeds with more or less balanced velocity components. It is statistically unlikely for an impactor’s motion to align predominantly with one of the randomly oriented axes. By construction, such a scenario would produce an outlier with our velocity component balance metric (see Section 4). It is apparent that five out of the six hyperbolic events fall within the tails of the distributions of velocity components in a geocentric Earth-fixed reference frame (Figure A.2 and Hajduková et al. 2024). This subset ranks among the top 5% of the overall database for at least one velocity component. For comparison, ten out of fifteen hyperbolic events in the EN catalog rank within the top 5%, while fourteen fall within the top 10%. However, none of these hyperbolic EN fireballs are considered interstellar. For reference and following (Hajduková et al. 2024), Figure A.3 in the appendix presents the corresponding velocity component representation for the EN catalog.
We calculated the Score(V) metric (Eq. (3)) for this hyperbolic subset of CNEOS and compared it to the rest of the events. We performed this comparison with a bootstrap approach following the method described in Section 4. The hyperbolic subset exhibits a statistically unlikely imbalance in their distribution of velocity components, being distinct from the overall population with a ∼90% of confidence.
If the CNEOS hyperbolic subset represents an outlier, its measurement errors are unlikely to align with the expected values of a normal distribution, potentially limiting the applicability of our DD-derived thresholds. The hyperbolic events 2014-01-08 17:05:34 and 2015-02-17 13:19:50 lie on the high-DD orbit region of Figure 1. Recall that we use the criteria established from the calibrated fireballs to determine if derived orbits have low-DD or high-DD (see Section 3.1). Additionally, we consider the old event occurred on 2009-04-10 18:42:45 as high-DD despite its energy exceeding 0.45 kt. These threshold were based on the calibrated fireballs which effectively are a random subset. Therefore, the calibrated subset probably does not include outliers, implying that the calibrated fireballs probably do not have unbalanced velocities or hyperbolic orbits. For this reason, we accept the 2009-04-10 18:42:45 fireball as an exception, a conclusion further supported by subsequent results. For the subset of these three events flagged as potentially high-DD (2014-01-08 17:05:34, 2015-02-17 13:19:50, and 2009-04-10 18:42:45), a p value of 0.003 was obtained, indicating strong evidence that they are statistically distinct from the overall population in terms of the balance of their velocity components.
In contrast, the subset of hyperbolic fireballs comprising of 2017-03-09 04:16:37, 2021-05-06 05:54:27, and 2022-07-28 01:36:08 yields a p value of 0.87, suggesting no excess between components. For comparison, the hyperbolic fireballs in the EN catalog have a p value of 0.93; the EN hyperbolics are not more imbalanced than the entire EN catalog. Figure 4 shows the bootstrap mean results for the calibrated and hyperbolic subsets of the CNEOS catalog, with reliability flagged based on our DD-derived criteria. An extreme outlier is evident, corresponding to a CNEOS hyperbolic event flagged as having an high-DD orbit. For comparison, Figure 4 also includes the mean results for hyperbolic events from the EN catalog. Overall, the EN catalog exhibits a slightly more balanced distribution of velocity components, as expected given its high-quality measurements and data processing.
While we cannot entirely rule out the possibility that genuine interstellar fireballs may appear as outliers, or conversely, that measurement errors could mimic such characteristics, a true interstellar subset should not consistently bias the velocity vector distribution. Such biases are more plausibly explained by errors. All p values computed in this work are summarized in Table 6.
If the CNEOS and EN catalogs were created by the same instruments and observing conditions, we would expect them to have similar overall characteristics. Specifically, if the CNEOS and EN catalogs measured the same population of fireballs with the same precision, there should be ∼6–7 hyperbolic events in the CNEOS database. These numbers are calculated because the EN reported ∼2% of impacts with hyperbolics orbits. Another cautionary fact is that the hyperbolic events reported in CNEOS exhibit eccentricities that exceed the maximum value recorded for the most hyperbolic fireball in the EN catalog. Moreover, a significant number of velocity components for the CNEOS hyperbolic fireballs fall within the tails of the distribution. This can be readily explained if these objects are high-velocity Solar System bodies measured with the less accuracy. This was the adopted explanation for the hyperbolic fireballs in the EN catalog (Borovička et al. 2022a).
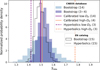 |
Fig. 4 Bootstrap results for the Score(V) metric (Eq. (4)), derived from geocentric velocity distributions. Light blue bars represent the bootstrap distribution generated by randomly selecting 14 samples from the calibrated subset flagged as low-DD orbits. Darker blue bars represent the average bootstrap distribution for the remaining CNEOS subsets: (i) calibrated flagged as high-DD orbits (4 samples), (ii) CNEOS hyperbolic flagged as high-DD (3 samples), and (iii) CNEOS hyperbolic flagged as low-DD (3 samples). The solid black contour line represents a histogram of bootstrap results from the EN catalog, generated by randomly selecting 15 samples. Sample sizes for subsets and bootstraps are in parentheses in the legend and are paired by their equal values. In all cases, the bootstrap process involved randomly selecting samples and evaluating the score metric 10000 times. The Score(V) quantifies the relative excess of each velocity component compared to the vector magnitude. Subsets on the right exhibit higher relative differences between velocity components, while those on the left indicate more balanced component values. The mean score is indicated for three groups: (i) calibrated fireball subsets from CNEOS (solid vertical lines), (ii) hyperbolic subsets in CNEOS (dashed lines), and (iii) hyperbolic subsets in the EN catalog (dotted line). The number of bins was calculated based on Sturges’s rule (Sturges 1926). |
Results of p values obtained by comparing the average sum of normalized absolute deviations for each subset against the overall database using a bootstrap approach.
The bold values in Table A.1 indicate the unbalanced velocity component. This excess lies in the x y plane in all three cases. This is expected if these hyperbolic impactors are native to our Solar System. This is because they are likely aligned with the ecliptic plane which more closely corresponds to the xy plane of the geocentric reference frame. This trend is also reflected in the mean velocities of the overall population, which are 9.4, 9.7, and 8.5 km/s for Vx, Vy, and Vz, respectively.
As is shown in Figure 3, the mean inclination for a real population of interstellar objects is around 90°. This is far from the case for the hyperbolic orbits in the CNEOS database which are biased toward low-inclination impactors. Indeed, the hyperbolic objects in CNEOS lie at the lower end of the inclination range. In the CNEOS database, the only three retrograde orbits occur in fireballs displaying large deviations in the Vy velocity component, leading to anomalously low-perihelion orbits (Hajduková et al. 2024). The bias toward prograde, low-inclination impactors in the CNEOS database can also be explained by their velocities, which are slower on average (18.5 km/s), typical of asteroidal fireballs. In contrast, the EN catalog has a higher average velocity (32.9 km/s). The EN catalog is a better representation of the overall near-Earth population because it is sensitive to a wider range of velocities, and consequently to a wider range of inclinations, as it includes cometary fireballs. This apparent bias toward low inclination and velocity in the CNEOS database raises the possibility that USG sensors may be less effective at detecting faster events. This interpretation is tentatively supported by the fact that approximately 20% of the EN catalog includes fireballs faster than the highest-velocity event recorded in CNEOS. Therefore, if CNEOS is systematically missing the fastest events because they are poorly measured, one would naturally expect the faster events that are reported to exhibit larger velocity uncertainties. However, this trend is not evident in the currently calibrated CNEOS events, as shown in the left panel of Figure 5, and was first noted by Socas-Navarro (2024). This absence is likely due to dataset limitations, such as selection bias or insufficient sample size, particularly for the low-DD events, where the apparent trend is strongly influenced by a single data point. Nevertheless, a trend is appreciable only in the high-DD group. We note that CNEOS has progressively included faster events (see right panel of Figure 5) while simultaneously improving accuracy (see top left panel of Figure 2). This evolution may complicate the identification of underlying trends, particularly given the small sample size. Nevertheless, we interpret the gradual inclusion of faster events as a reflection of improvements in observational capabilities and/or data reduction methods.
Additionally, almost all hyperbolic fireballs in the EN catalog are retrograde. Moreover, higher inclination fireballs in the EN catalog tend to be correlated with hyperbolic orbits (Figure 3). This likely reflects an increased probability of head-on collisions with Earth at near-ecliptic retrograde orbits, which raises the relative velocity and the likelihood of measurement inaccuracies (see the end of Section 1). Furthermore, the population of CNEOS hyperbolic fireballs shows an unlikely imbalance in their velocity components.
Based on our estimated orbital uncertainties (see Table 4), four of the six hyperbolic events could become elliptical within the confidence range of the high-DD group, assuming similarity to the calibrated subset. The 2014 and 2017 hyperbolic CNEOS events require specific parameter variations to become elliptical, but these variations also fall within the range observed in the calibrated set. Therefore, the CNEOS hyperbolic subset listed in Table A. 1 is unlikely interstellar; they are more likely high-velocity fireballs resulting from large measurement errors. This is further supported by the fact that all the hyperbolic orbits exhibit prograde motion — see Figure 3 (top).
This assessment of the reliability of CNEOS hyperbolic events should be regarded as a statement about the overall population observed in the database and does not refute individual events. Individual analyses would require access to raw data, detailed instrument specifications or independent measurements of these events.
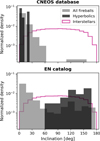 |
Fig. 3 Normalized density distributions of orbital inclinations for all fireballs in the CNEOS (top) and EN (bottom) catalogs. An expected orbital inclination for an incoming interstellar population is depicted for reference, following Marčeta (2023). The number of bins was calculated based on Sturges’s rule (Sturges 1926). |
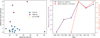 |
Fig. 5 Left: absolute velocity error as a function of velocity for the all calibrated CNEOS events, and for the low-DD(DD < 0.1) and high-DD (DD > 0.1) groups. Fireballs with DD < 0.008 have a yellow plus symbol. Right: time evolution of the maximum velocity and the mean velocity of faster events reported by CNEOS. |
6 Conclusions
Understanding the accuracy of fireball orbital data is essential for assessing meteoroid impact hazards and identifying potential interstellar objects. The CNEOS database, derived from U.S. Government space-based sensors, provides near-global coverage of fireball events, yet the uncertainties in its orbital determinations remain largely uncharacterized due to the classified nature of its instrumentation. In this study, we quantified these uncertainties by systematically evaluating the reliability of CNEOS-derived orbits. To achieve this, we applied the well-established DD criterion, comparing CNEOS-derived orbital elements to independent ground-based measurements. This allowed us to identify the conditions under which CNEOS orbits have lower or higher DD values. Additionally, we assessed the balance of geocentric velocity components within the CNEOS database using a bootstrap approach to test for systematic measurement biases, particularly in hyperbolic fireballs.
It is possible that USG sensors correspond to the infrared early warning satellites operated by the U.S. Space Force such as the Space-Based Infrared System (SBIRS). However, neither SBIRS nor its predecessor, the Defense Support Program (DSP), are explicitly mentioned on the CNEOS website. Although this attribution cannot be confirmed, the fact that SBIRS remains the only operational space-based infrared early warning system currently fielded by the United States during decommissioning of DSP provides at least circumstantial evidence to the hypothesis. The transition from DSP to SBIRS began in 2008, with a significant upgrade in operational capacity through SBIRS Block 10 in 2016. Further improvements culminated in the operational acceptance of Block 20 in 2019 (Director, Operational Test and Evaluation (DOT&E) 2019). This gradual transition may explain the higher DD observed prior to this period, as DSP’s exclusive use of geostationary satellites limited coverage at higher latitudes. In contrast, SBIRS combines geostationary and highly elliptical orbit sensors, enabling improved spatial coverage and accuracy across a wider range of latitudes (Space Operations Command, United States Space Force 2023). However, we reiterate that this hypothesis is reliant on circumstantial evidence at best.
We conclud that CNEOS events have DD < 0.1 orbits either (i) after 2017 or (ii) for fireballs with impact energies exceeding 0.45 kt, which is observed in 74–78% of the events with an average DD = 0.03 ± 0.02. Using a more conservative cutoff of DD < 0.05, 63–67% of CNEOS events have low-DD orbits, while using DD < 0.008 only ∼11% would have low-DD. Our analysis identifies year and energy as the only reliable parameters that, when combined, effectively classify the accuracy groups of the CNEOS database for DD < 0.1. While other parameters, such as daylight and the z-velocity component, show potential as reliability indicators, they lack a physical interpretation. Additionally, low altitude, duration, and latitude might correlate with smaller errors. For smaller DD cutoffs, we did not find either any statistically significant discriminant. However, the limited number of well-characterized events constrains our ability to robustly evaluate parameter dependencies, and likely obscures correlations that may exist in a larger sample.
We provide orbital element (along with radiant and velocity) uncertainties for each group and observe a distinctive improvement in CNEOS data accuracy over time, where faster events have been progressively reported. We conclude that this is likely caused by advancements in the underlying USG sensors. These advancements presumably include the transition from the geostationary DSP satellites to the SBIRS system; the latter incorporates satellites on highly elliptical orbits and provides better monitoring capabilities.
There are six hyperbolic fireballs in the CNEOS database. We find that this hyperbolic subset differs from the overall population with a ∼90% confidence. However, genuine interstellar impactors should not exhibit distinct velocity vector characteristics in a geocentric reference frame. We conclude that the three hyperbolic events before 2018 are extremely likely outliers in terms of the imbalance of their velocity components, including the proposed first interstellar meteor identified by Siraj & Loeb (2022a). Therefore, the CNEOS hyperbolic fireball population is unlikely of interstellar origin because:
They display both an excess in one component of their velocity vector — lying in the tail of the overall fireball distribution (Hajduková et al. 2024) — and a systematic imbalance among the three velocity components.
They are exclusively high-velocity impactors, yet slower interstellar fireballs should also be present (Hajduková et al. 2019; Hajdukova et al. 2020; Hajduková et al. 2024).
They all exhibit prograde motion, but interstellar impactors should have an approximately 50:50 prograde-retrograde distribution (Hajduková et al. 2024).
Their velocity vector components exhibit an unlikely imbalance.
They differ significantly from hyperbolic fireballs in other reliable databases.
CNEOS fails to report faster fireballs, suggesting potential detection biases against high-velocity events.
>22% of CNEOS events show significant inaccuracies in a random sample, meaning that if hyperbolics form an outlier subset, their errors may be even larger.
Based on this, CNEOS hyperbolic group is more plausibly explained as mismeasurements of fast impactors. However, without additional information (e.g., raw data, observation geometry, instrument sensitivity), definitive conclusions cannot be drawn for individual events, and true interstellar fireballs may be hidden among uncertainties.
In summary, while the CNEOS dataset provides valuable global insights into fireball activity, its use for precise orbital determinations requires caution (Devillepoix et al. 2019; Peña-Asensio et al. 2024b; Brown & Borovička 2023; Hajduková et al. 2024; Chow & Brown 2025), particularly for the older or less energetic impacts. Our work may help establish confidence limits for the events registered in the database. Continued improvements in sensor systems and cross-validation with independent ground-based measurements are essential for advancing our understanding of these phenomena, particularly for identifying potential interstellar fireballs within the database.
Acknowledgements
EP-A acknowledges support from the LUMIO project funded by the Agenzia Spaziale Italiana (2024-6-HH.0). DZS is supported by an NSF Astronomy and Astrophysics Postdoctoral Fellowship under award AST-2303553. This research award is partially funded by a generous gift of Charles Simonyi to the NSF Division of Astronomical Sciences. The award is made in recognition of significant contributions to Rubin Observatory’s Legacy Survey of Space and Time. We extend our gratitude to Marco Langbroek for his assistance with information regarding USG sensors. DZS thanks Lia Corrales for helpful conversations. We thank T. Jopek for the clarification on the dependence of the DD threshold on sample size and the limitations of extrapolating his cutoff formula to individual pairs.
Appendix A Supporting figures
Figure A.1 illustrates the relationship between DD values and some key fireball parameters: time and total impact energy. Three fireballs that occurred during mid-2015 exhibit notably high DD values (top panel); the other high DD value event is the second oldest calibrated fireball. Moreover, Figure A.1 demonstrates that events with higher DD values consistently exhibit lower than average energy levels (bottom panel). The full list of hyperbolic fireballs considered is provided in Table A.1, which includes their geolocation, energy, and pre-impact velocity components. Figures A.2 and A.3 show the distribution of these velocity components for the CNEOS and EN datasets.
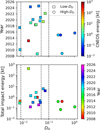 |
Fig. A.1 Relationship between the DD values (comparing CNEOS-derived and ground-based orbits) and fireball time (top) and total impact energy (bottom). These values are for the 18 calibrated fireballs, and fireball parameters are those provided by the CNEOS database. Selected DD thresholds are indicated with dashed vertical lines corresponding to cutoff values of 0.008, 0.05, and 0.1. Fireballs flagged as having low-DD (DD < 0.1) are denoted by squares and high-DD(DD > 0.1) with circles. Fireballs in each panel are color-coded according to the y axis variable of the other panel. |
List of 6 hyperbolic fireballs in the CNEOS database.
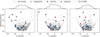 |
Fig. A.2 Relationship between the total velocity and the pre-impact velocity components in a geocentric Earth-fixed reference frame, as provided by the CNEOS database. Fireballs flagged as having low-DD(DD < 0.1) are denoted by blue squares and high-DD(DD > 0.1) with red circles. Fireballs with DD < 0.008 have a yellow plus symbol. The normalized histogram for each component is stacked above the top frame of each panel. The number of bins was calculated based on Sturges’s rule (Sturges 1926). Adapted from (Hajduková et al. 2024). |
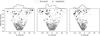 |
Fig. A.3 Relationship between the total velocity and the pre-impact velocity components in a geocentric J2000 reference frame, as provided by the EN catalog. Hyperbolic fireballs are marked with crosses. The normalized histogram for each component is stacked above the top frame of each panel. The number of bins was calculated based on Sturges’s rule (Sturges 1926). Same representation as in Hajduková et al. (2024). |
References
- Abedin, A., Spurný, P., Wiegert, P., et al. 2015, Icarus, 261, 100 [NASA ADS] [CrossRef] [Google Scholar]
- Almond, M., Davies, J. G., & Lovell, A. C. B., 1951, MNRAS, 111, 585 [CrossRef] [Google Scholar]
- Andrade, M., Docobo, J., García-Guinea, J., et al. 2023, MNRAS, 518, 3850 [Google Scholar]
- Baggaley, W. J., 2000, J. Geophys. Res., 105, 10353 [NASA ADS] [CrossRef] [Google Scholar]
- Bischoff, A., Patzek, M., Barrat, J.-A., et al. 2024, Meteor. Planet. Sci., 59, 2660 [Google Scholar]
- Borisov, G., Durig, D. T., Sato, H., et al. 2019, Central Bureau Electron. Telegrams, 4666, 1 [Google Scholar]
- Borovička, J., & Charvát, Z., 2009, A&A, 507, 1015 [NASA ADS] [CrossRef] [EDP Sciences] [Google Scholar]
- Borovička, J., Spurný, P., Brown, P., et al. 2013a, Nature, 503, 235 [NASA ADS] [Google Scholar]
- Borovička, J., Tóth, J., Igaz, A., et al. 2013b, Meteor. Planet. Sci., 48, 1757 [CrossRef] [Google Scholar]
- Borovička, J., Spurný, P., Grigore, V. I., & Svoreň, J., 2017, Planet. Space Sci., 143, 147 [CrossRef] [Google Scholar]
- Borovička, J., Bettonvil, F., Baumgarten, G., et al. 2021, Meteor. Planet. Sci., 56, 425 [CrossRef] [Google Scholar]
- Borovička, J., Spurný, P., & Shrbený, L. 2022a, A&A, 667, A158 [NASA ADS] [CrossRef] [EDP Sciences] [Google Scholar]
- Borovička, J., Spurný, P., Shrbený, L., et al. 2022b, A&A, 667, A157 [NASA ADS] [CrossRef] [EDP Sciences] [Google Scholar]
- Brown, P. G., & Borovička, J., 2023, ApJ, 953, 167 [NASA ADS] [CrossRef] [Google Scholar]
- Brown, P., Spalding, R. E., ReVelle, D. O., Tagliaferri, E., & Worden, S. P., 2002, Nature, 420, 294 [Google Scholar]
- Brown, P., Wong, D. K., Weryk, R. J., & Wiegert, P., 2010, Icarus, 207, 66 [NASA ADS] [CrossRef] [Google Scholar]
- Brown, P. G., Assink, J. D., Astiz, L., et al. 2013, Nature, 503, 238 [NASA ADS] [Google Scholar]
- Brown, P., Wiegert, P., Clark, D., & Tagliaferri, E., 2016, Icarus, 266, 96 [CrossRef] [Google Scholar]
- Ceplecha, Z., 1987, Bull. Astron. Inst. Czech., 38, 222 [NASA ADS] [Google Scholar]
- Chow, I., & Brown, P. G., 2025, Icarus, 429, 116444 [Google Scholar]
- Cook, N. V., Ragozzine, D., Granvik, M., & Stephens, D. C., 2016, ApJ, 825, 51 [NASA ADS] [CrossRef] [Google Scholar]
- de la Fuente Marcos, C., & de la Fuente Marcos, R., 2018a, MNRAS, 473, 3434 [Google Scholar]
- de la Fuente Marcos, C., & de la Fuente Marcos, R., 2018b, MNRAS, 473, 2939 [NASA ADS] [CrossRef] [Google Scholar]
- de la Fuente Marcos, R., Alarcon, M. R., Licandro, J., et al. 2025, A&A, 700, L9 [NASA ADS] [CrossRef] [EDP Sciences] [Google Scholar]
- Denneau, L., Siverd, R., Tonry, J., et al. 2025, 3I/ATLAS = C/2025 N1 (ATLAS), MPEC [Google Scholar]
- Desch, S., & Jackson, A., 2023, arXiv e-prints [arXiv:2311.07699] [Google Scholar]
- Devillepoix, H. A. R., Bland, P. A., Sansom, E. K., et al. 2019, MNRAS, 483, 5166 [NASA ADS] [CrossRef] [Google Scholar]
- Di Mare, L., Cicalò, S., Rossi, A., Alessi, E. M., & Valsecchi, G. B., 2019, in LPI Contributions, 2109, First International Orbital Debris Conference, 6007 [Google Scholar]
- Director, Operational Test and Evaluation (DOT&E) 2019, FY2019 Annual Report: Space-Based Infrared System (SBIRS), https://www.dote.osd.mil/Portals/97/pub/reports/FY2019/af/2019sbirs.pdf?ver=2020-01-30-115238-610. Accessed: 1st April 2025 [Google Scholar]
- Drummond, J. D., 1981, Icarus, 45, 545 [NASA ADS] [CrossRef] [Google Scholar]
- Drummond, J. D., 2000, Icarus, 146, 453 [Google Scholar]
- Ďurišová, S., Neslušan, L., Hajduková, M., Rudawska, R., & Jopek, T. J., 2024, MNRAS, 535, 3661 [Google Scholar]
- Egal, A., Gural, P. S., Vaubaillon, J., Colas, F., & Thuillot, W., 2017, Icarus, 294, 43 [NASA ADS] [CrossRef] [Google Scholar]
- Engelhardt, T., Jedicke, R., Vereš, P., et al. 2017, AJ, 153, 133 [NASA ADS] [CrossRef] [Google Scholar]
- Farnocchia, D., Jenniskens, P., Robertson, D. K., et al. 2017, Icarus, 294, 218 [NASA ADS] [CrossRef] [Google Scholar]
- Fernando, B., Mialle, P., Ekström, G., et al. 2024, Geophys. J. Int., 238, 1027 [Google Scholar]
- Fisher, W. J., 1928, Harvard Coll. Observ. Circ., 331, 1 [Google Scholar]
- Fitzsimmons, A., Meech, K., Matrà, L., Pfalzner, S., & Dotson, R., 2024, Interstellar Objects and Exocomets (University of Arizona Press), 731 [Google Scholar]
- Froncisz, M., Brown, P., & Weryk, R. J., 2020, Planet. Space Sci., 190, 104980 [Google Scholar]
- Fu, H., Jedicke, R., Durda, D. D., Fevig, R., & Scotti, J. V., 2005, Icarus, 178, 434 [Google Scholar]
- Galligan, D. P., 2001, MNRAS, 327, 623 [NASA ADS] [CrossRef] [Google Scholar]
- Grün, E., & Landgraf, M., 2000, J. Geophys. Res., 105, 10291 [Google Scholar]
- Grün, E., Zook, H. A., Baguhl, M., et al. 1993, Nature, 362, 428 [Google Scholar]
- Grün, E., Staubach, P., Baguhl, M., et al. 1997, Icarus, 129, 270 [Google Scholar]
- HajdukovaJr., M. 1994, A&A, 288, 330 [Google Scholar]
- HajdukováJr., M., 1993, in Meteoroids and their Parent Bodies, eds. J. Stohl, & I. P. Williams, 61 [Google Scholar]
- Hajduková, M., & Kornoš, L., 2020, Planet. Space Sci., 190, 104965 [CrossRef] [Google Scholar]
- Hajduková, M., Kornoš, L., & Tóth, J., 2014, Meteor. Planet. Sci., 49, 63 [Google Scholar]
- Hajduková, M., Sterken, V., & Wiegert, P., 2019, Meteoroids: Sources of Meteors on Earth and Beyond (Cambridge University Press), 235 [Google Scholar]
- Hajdukova, M., Sterken, V., Wiegert, P., & Kornoš, L., 2020, Planet. Space Sci., 192, 105060 [NASA ADS] [CrossRef] [Google Scholar]
- Hajduková, M., Stober, G., Barghini, D., et al. 2024, A&A, 691, A8 [NASA ADS] [CrossRef] [EDP Sciences] [Google Scholar]
- Halliday, I., Blackwell, A. T., & Griffin, A. A., 1990, Meteoritics, 25, 93 [Google Scholar]
- Hildebrand, A. R., Hanton, L. T. J., Ciceri, F., et al. 2018, in 49th Annual Lunar and Planetary Science Conference, Lunar and Planetary Science Conference, 3006 [Google Scholar]
- Hoover, D. J., Seligman, D. Z., & Payne, M. J., 2022, Planet. Sci. J., 3, 71 [NASA ADS] [CrossRef] [Google Scholar]
- Humpage, A., & Christou, A. A., 2024, MNRAS, 533, 1412 [Google Scholar]
- Jacchia, L. G., & Whipple, F. L., 1961, Smithsonian Contrib. Astrophys., 4, 97 [CrossRef] [Google Scholar]
- Janches, D., Bruzzone, J. S., Weryk, R. J., et al. 2020, ApJ, 895, L25 [NASA ADS] [CrossRef] [Google Scholar]
- Jenniskens, P., Shaddad, M. H., Numan, D., et al. 2009, Nature, 458, 485 [NASA ADS] [CrossRef] [PubMed] [Google Scholar]
- Jenniskens, P., Gabadirwe, M., Yin, Q.-Z., et al. 2021, Meteor. Planet. Sci., 56, 844 [NASA ADS] [CrossRef] [Google Scholar]
- Jewitt, D., 2024, Interstellar Objects in the Solar System (Cham: Springer International Publishing), 1 [Google Scholar]
- Jewitt, D., & Seligman, D. Z., 2023, Annu. Rev. Astron. Astrophys., 61, 197 [Google Scholar]
- Jopek, T. J., & Bronikowska, M., 2017, Planet. Space Sci., 143, 43 [NASA ADS] [CrossRef] [Google Scholar]
- Jopek, T. J., & Froeschle, C., 1997, A&A, 320, 631 [NASA ADS] [Google Scholar]
- JPL-Horizons 2025a, 2019 MO orbit parameters,https://ssd.jpl.nasa.gov/tools/sbdb_lookup.html\#/?sstr=2019%20MO. Accessed: 1st January 2025 [Google Scholar]
- JPL-Horizons 2025b, 2022 EB5 orbit parameters, https://ssd.jpl.nasa.gov/tools/sbdb_lookup.html\#/?sstr=2022%20EB5. Accessed: 1st January 2025 [Google Scholar]
- JPL-Horizons 2025c, 2024 RW1 orbit parameters, https://ssd.jpl.nasa.gov/tools/sbdb_lookup.html\#/?sstr=2024%20RW1. Accessed: 1st January 2025 [Google Scholar]
- Kartashova, A., Golubaev, A., Mozgova, A., et al. 2020, Planet. Space Sci., 193, 105034 [CrossRef] [Google Scholar]
- Koten, P., Borovička, J., Spurný, P., et al. 2006, MNRAS, 366, 1367 [NASA ADS] [CrossRef] [Google Scholar]
- Koten, P., Shrbený, L., Spurný, P., et al. 2023, A&A, 675, A70 [NASA ADS] [CrossRef] [EDP Sciences] [Google Scholar]
- Kyrylenko, I., Golubov, O., Slyusarev, I., et al. 2023, ApJ, 953, 20 [Google Scholar]
- Landgraf, M., Baggaley, W. J., Grün, E., Krüger, H., & Linkert, G., 2000, J. Geophys. Res., 105, 10343 [NASA ADS] [CrossRef] [Google Scholar]
- Le Pichon, A., Antier, K., Cansi, Y., et al. 2008, Meteor. Planet. Sci., 43, 1797 [Google Scholar]
- Marčeta, D., 2023, Astron. Comput., 42, 100690 [Google Scholar]
- Marčeta, D., & Seligman, D. Z., 2023, Planet. Sci. J., 4, 230 [CrossRef] [Google Scholar]
- Matlovič, P., Kornoš, L., Kováčová, M., Tóth, J., & Licandro, J., 2020, A&A, 636, A122 [NASA ADS] [CrossRef] [EDP Sciences] [Google Scholar]
- McIntosh, B. A., 1990, Icarus, 86, 299 [Google Scholar]
- Meisel, D. D., Janches, D., & Mathews, J. D., 2002, ApJ, 579, 895 [Google Scholar]
- Milley, E. P., 2010, Master’s thesis, University of Calgary, Canada [Google Scholar]
- Moorhead, A. V., 2016, MNRAS, 455, 4329 [CrossRef] [Google Scholar]
- Moskovitz, N. A., Fatka, P., Farnocchia, D., et al. 2019, Icarus, 333, 165 [NASA ADS] [CrossRef] [Google Scholar]
- Neslušan, L., Svoreň, J., & Porubčan, V., 1995, Earth Moon Planets, 68, 427 [CrossRef] [Google Scholar]
- Olech, A., Żołądek, P., Wiśniewski, M., et al. 2016, MNRAS, 461, 674 [Google Scholar]
- Opik, E. J., 1956, Irish Astron. J., 4, 84 [Google Scholar]
- Palotai, C., Sankar, R., Free, D. L., et al. 2019, MNRAS, 487, 2307 [Google Scholar]
- Peña-Asensio, E., & Sánchez-Lozano, J. M., 2024, Adv. Space Res., 74, 1073 [Google Scholar]
- Peña-Asensio, E., Trigo-Rodríguez, J. M., Gritsevich, M., & Rimola, A., 2021, MNRAS, 504, 4829 [Google Scholar]
- Peña-Asensio, E., Trigo-Rodríguez, J. M., & Rimola, A., 2022, AJ, 164, 76 [Google Scholar]
- Peña-Asensio, E., Trigo-Rodríguez, J. M., Rimola, A., Corretgé-Gilart, M., & Koschny, D., 2023, MNRAS, 520, 5173 [Google Scholar]
- Peña-Asensio, E., Küppers, M., Trigo-Rodríguez, J. M., & Rimola, A. 2024a, Planet. Sci. J., 5, 206 [Google Scholar]
- Peña-Asensio, E., Visuri, J., Trigo-Rodríguez, J. M., et al. 2024b, Icarus, 408, 115844 [CrossRef] [Google Scholar]
- Peña-Asensio, E., Grèbol-Tomàs, P., Trigo-Rodríguez, J. M., Ramírez-Moreta, P., & Kresken, R., 2024, MNRAS, 533, L92 [Google Scholar]
- Rożek, A., Breiter, S., & Jopek, T. J., 2011, MNRAS, 412, 987 [NASA ADS] [Google Scholar]
- Seligman, D., & Laughlin, G., 2018, AJ, 155, 217 [Google Scholar]
- Seligman, D. Z., & Moro-Martín, A., 2022, Contemp. Phys., 63, 200 [Google Scholar]
- Seligman, D. Z., Micheli, M., Farnocchia, D., et al. 2025, ApJ, 989, L36 [Google Scholar]
- Sergienko, M. V., Sokolova, M. G., & Kholshevnikov, K. V. 2020a, Astron. Rep., 64, 458 [Google Scholar]
- Sergienko, M. V., Sokolova, M. G., Nefedyev, Y. A., & Andreev, A. O. 2020b, Astron. Rep., 64, 1087 [Google Scholar]
- Shober, P. M., & Vaubaillon, J., 2024, A&A, 686, A130 [NASA ADS] [CrossRef] [EDP Sciences] [Google Scholar]
- Siraj, A., & Loeb, A. 2022a, ApJ, 939, 53 [NASA ADS] [CrossRef] [Google Scholar]
- Siraj, A., & Loeb, A. 2022b, ApJ, 941, L28 [NASA ADS] [CrossRef] [Google Scholar]
- Socas-Navarro, H., 2024, arXiv e-prints [arXiv:2405.17219] [Google Scholar]
- Sokolova, M. G., Kondratyeva, E. D., & Nefedyev, Y. A., 2013, Adv. Space Res., 52, 1217 [Google Scholar]
- Southworth, R. B., & Hawkins, G. S., 1963, Smithsonian Contrib. Astrophys., 7, 261 [Google Scholar]
- Space Operations Command, United States Space Force, 2023, Factsheet of the Space Based Infrared System (SBIRS), https://media.defense.gov/2023/Feb/10/2003159902/-1/-1/1/SBIRS%20FACTSHEET.PDF. Accessed: 1st January 2025 [Google Scholar]
- Spurný, P., Oberst, J., & Heinlein, D., 2003, Nature, 423, 151 [Google Scholar]
- Spurný, P., Borovička, J., & Shrbený, L., 2020, Meteor. Planet. Sci., 55, 376 [CrossRef] [Google Scholar]
- Štohl, J., 1970, Bull. Astron. Inst. Czech., 21, 10 [NASA ADS] [Google Scholar]
- Sturges, H. A., 1926, J. Am. Statist. Assoc., 21, 65 [CrossRef] [Google Scholar]
- Tagliaferri, E., Spalding, R., Jacobs, C., Worden, S. P., & Erlich, A., 1994, in Hazards Due to Comets and Asteroids, 199 [Google Scholar]
- Unsalan, O., Jenniskens, P., Yin, Q.-Z., et al. 2019, Meteor. Planet. Sci., 54, 953 [NASA ADS] [CrossRef] [Google Scholar]
- Vida, D., Brown, P. G., Campbell-Brown, M., Wiegert, P., & Gural, P. S., 2020, MNRAS, 491, 3996 [NASA ADS] [CrossRef] [Google Scholar]
- Vida, D., Šegon, D., Šegon, M., et al. 2021, in European Planetary Science Congress, EPSC 2021–139 [Google Scholar]
- Von Niessl, G., & Hoffmeister, C., 1925, Denkschriften der Kaiserlichen Akademie der Wissenschaften Wien. Mathematisch-Naturwissenchaftliche Klasse, 100, 1 [Google Scholar]
- Weryk, R. J., & Brown, P., 2004, Earth Moon Planets, 95, 221 [Google Scholar]
- Whipple, F. L., & Jacchia, L. G., 1957, Smithsonian Contrib. Astrophys., 1, 183 [Google Scholar]
- Wiegert, P. A., 2014, Icarus, 242, 112 [NASA ADS] [CrossRef] [Google Scholar]
- Wiegert, P., & Brown, P., 2005, Icarus, 179, 139 [NASA ADS] [CrossRef] [Google Scholar]
- Williams, I. P., & Wu, Z., 1993, MNRAS, 262, 231 [NASA ADS] [Google Scholar]
- Williams, I. P., Ryabova, G. O., Baturin, A. P., & Chernitsov, A. M., 2004, MNRAS, 355, 1171 [Google Scholar]
- Williams, G. V., Sato, H., Sarneczky, K., et al. 2017, Central Bureau Electron. Telegrams, 4450, 1 [Google Scholar]
- Wisniewski, K. S., Brown, P. G., Moser, D. E., & Longenbaugh, R., 2024, Icarus, 417, 116118 [Google Scholar]
- Wu, Z., & Williams, I. P., 1992, MNRAS, 259, 617 [NASA ADS] [Google Scholar]
- Zuluaga, J. I., Cuartas-Restrepo, P. A., Ospina, J., & Sucerquia, M., 2019, MNRAS, 486, L69 [CrossRef] [Google Scholar]
The longitude of maximal fireball energy is reported by CNEOS.
During the publication process of this work, CNEOS updated the timestamps of half of the hyperbolic events by 1s. Energies were recalculated to lower values (difference < 0.1 kt). The event of 8 January 2014 also had its reported position corrected by 0.5°.
For more information, see the discussion in the second to last paragraph in the introduction of this paper.
Dates are given in the numerical year-month-day format (YYYY-MM-DD) and, when applicable, with hours-minutes-seconds (hh:mm:ss), to maintain consistency with previous literature and with the format used by CNEOS.
All Tables
DD thresholds applied in various literature studies to assess the similarity of meteoroid stream member orbits.
Physical properties of 18 orbit-calibrated fireballs reported in the CNEOS database.
Heliocentric orbital elements in the ecliptic J2000 reference frame of calibrated fireballs.
Median and (upper and lower) 1 σ standard deviations of the DD values and orbital element, velocity, and geocentric radiant errors for the 18 calibrated fireballs from CNEOS.
pB values for different parameters tested as discriminants, under different significance thresholds for three different DD thresholds.
Results of p values obtained by comparing the average sum of normalized absolute deviations for each subset against the overall database using a bootstrap approach.
All Figures
|
Fig. 1 Total impact energy provided by CNEOS as a function fireball year. Hyperbolic and calibrated (with independently determined orbits from ground-based observations) events are indicated with diamonds and crosses, respectively. The color of calibrated event markers corresponds to the DD value between CNEOS-derived and ground-based orbits. Selected DD thresholds are indicated by a dotted line on the colorbar, delimiting each sub-colormap segment. The gray area highlights the parameter space that results in high-DD orbits for the calibrated events (based on the criteria DD < 0.1). Two vertical and two horizontal dashed lines define the possible boundaries of the high-DD orbit region. 2008 TC3 has been sign-corrected following Peña-Asensio et al. (2022). |
| In the text | |
|
Fig. 2 Discriminants identified with the statistical test. First-row panels: date (left), energy (center), and altitude (right). Second-row panels: absolute latitude (left), longitude (center), atmospheric entry angle (right). Third-row panels: Daylight (left), duration (center), and velocity (right). Fourth-row panels: x-velocity component (left), y-velocity component (center), and z-velocity component (right). The filled light blue region represents consecutive low-DD events, while the solid line depicts their cumulative percentage, offering a visual indication of the discriminant’s effectiveness. Fireballs flagged as low-DD(DD < 0.1) are denoted by blue squares and high-DD(DD > 0.1) with red circles. Fireballs with DD < 0.008 have a yellow plus symbol. |
| In the text | |
|
Fig. 3 Normalized density distributions of orbital inclinations for all fireballs in the CNEOS (top) and EN (bottom) catalogs. An expected orbital inclination for an incoming interstellar population is depicted for reference, following Marčeta (2023). The number of bins was calculated based on Sturges’s rule (Sturges 1926). |
| In the text | |
|
Fig. 4 Bootstrap results for the Score(V) metric (Eq. (4)), derived from geocentric velocity distributions. Light blue bars represent the bootstrap distribution generated by randomly selecting 14 samples from the calibrated subset flagged as low-DD orbits. Darker blue bars represent the average bootstrap distribution for the remaining CNEOS subsets: (i) calibrated flagged as high-DD orbits (4 samples), (ii) CNEOS hyperbolic flagged as high-DD (3 samples), and (iii) CNEOS hyperbolic flagged as low-DD (3 samples). The solid black contour line represents a histogram of bootstrap results from the EN catalog, generated by randomly selecting 15 samples. Sample sizes for subsets and bootstraps are in parentheses in the legend and are paired by their equal values. In all cases, the bootstrap process involved randomly selecting samples and evaluating the score metric 10000 times. The Score(V) quantifies the relative excess of each velocity component compared to the vector magnitude. Subsets on the right exhibit higher relative differences between velocity components, while those on the left indicate more balanced component values. The mean score is indicated for three groups: (i) calibrated fireball subsets from CNEOS (solid vertical lines), (ii) hyperbolic subsets in CNEOS (dashed lines), and (iii) hyperbolic subsets in the EN catalog (dotted line). The number of bins was calculated based on Sturges’s rule (Sturges 1926). |
| In the text | |
|
Fig. 5 Left: absolute velocity error as a function of velocity for the all calibrated CNEOS events, and for the low-DD(DD < 0.1) and high-DD (DD > 0.1) groups. Fireballs with DD < 0.008 have a yellow plus symbol. Right: time evolution of the maximum velocity and the mean velocity of faster events reported by CNEOS. |
| In the text | |
|
Fig. A.1 Relationship between the DD values (comparing CNEOS-derived and ground-based orbits) and fireball time (top) and total impact energy (bottom). These values are for the 18 calibrated fireballs, and fireball parameters are those provided by the CNEOS database. Selected DD thresholds are indicated with dashed vertical lines corresponding to cutoff values of 0.008, 0.05, and 0.1. Fireballs flagged as having low-DD (DD < 0.1) are denoted by squares and high-DD(DD > 0.1) with circles. Fireballs in each panel are color-coded according to the y axis variable of the other panel. |
| In the text | |
|
Fig. A.2 Relationship between the total velocity and the pre-impact velocity components in a geocentric Earth-fixed reference frame, as provided by the CNEOS database. Fireballs flagged as having low-DD(DD < 0.1) are denoted by blue squares and high-DD(DD > 0.1) with red circles. Fireballs with DD < 0.008 have a yellow plus symbol. The normalized histogram for each component is stacked above the top frame of each panel. The number of bins was calculated based on Sturges’s rule (Sturges 1926). Adapted from (Hajduková et al. 2024). |
| In the text | |
|
Fig. A.3 Relationship between the total velocity and the pre-impact velocity components in a geocentric J2000 reference frame, as provided by the EN catalog. Hyperbolic fireballs are marked with crosses. The normalized histogram for each component is stacked above the top frame of each panel. The number of bins was calculated based on Sturges’s rule (Sturges 1926). Same representation as in Hajduková et al. (2024). |
| In the text | |
Current usage metrics show cumulative count of Article Views (full-text article views including HTML views, PDF and ePub downloads, according to the available data) and Abstracts Views on Vision4Press platform.
Data correspond to usage on the plateform after 2015. The current usage metrics is available 48-96 hours after online publication and is updated daily on week days.
Initial download of the metrics may take a while.