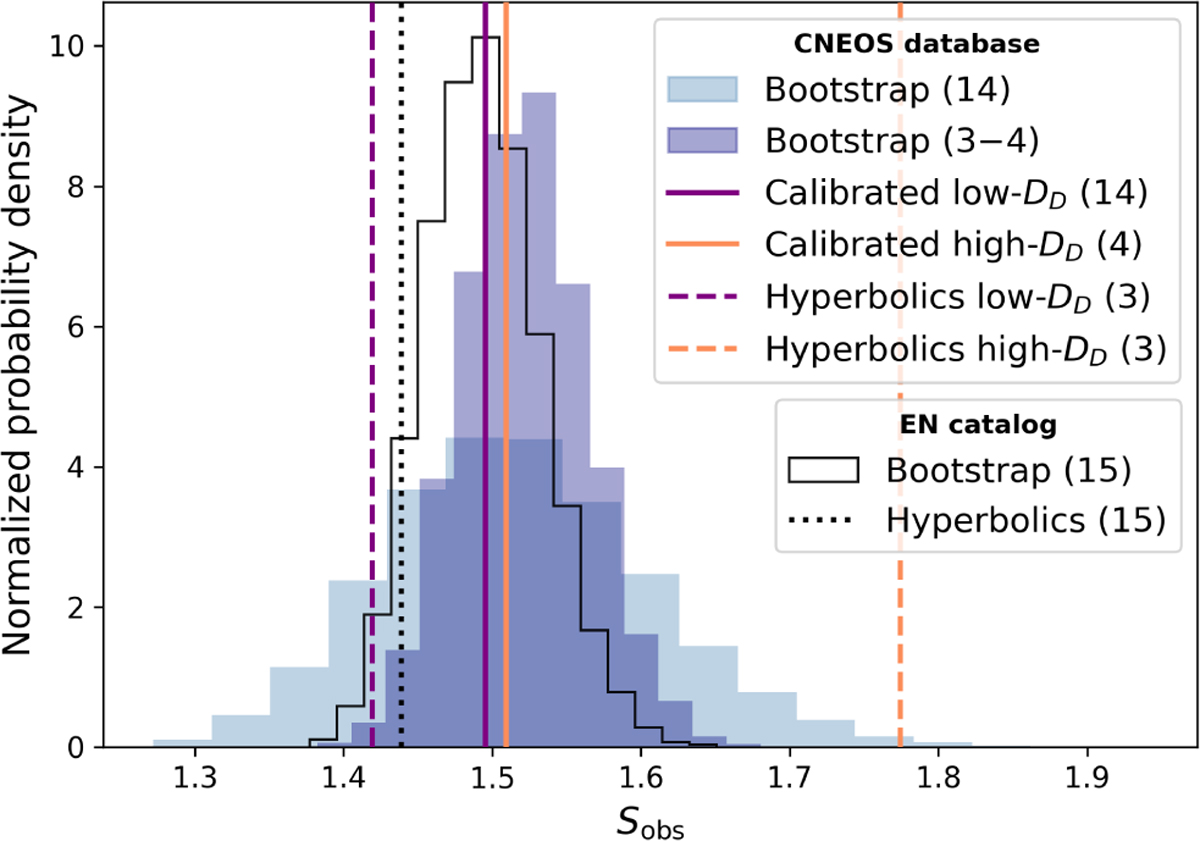
Fig. 4
Download original image
Bootstrap results for the Score(V) metric (Eq. (4)), derived from geocentric velocity distributions. Light blue bars represent the bootstrap distribution generated by randomly selecting 14 samples from the calibrated subset flagged as low-DD orbits. Darker blue bars represent the average bootstrap distribution for the remaining CNEOS subsets: (i) calibrated flagged as high-DD orbits (4 samples), (ii) CNEOS hyperbolic flagged as high-DD (3 samples), and (iii) CNEOS hyperbolic flagged as low-DD (3 samples). The solid black contour line represents a histogram of bootstrap results from the EN catalog, generated by randomly selecting 15 samples. Sample sizes for subsets and bootstraps are in parentheses in the legend and are paired by their equal values. In all cases, the bootstrap process involved randomly selecting samples and evaluating the score metric 10000 times. The Score(V) quantifies the relative excess of each velocity component compared to the vector magnitude. Subsets on the right exhibit higher relative differences between velocity components, while those on the left indicate more balanced component values. The mean score is indicated for three groups: (i) calibrated fireball subsets from CNEOS (solid vertical lines), (ii) hyperbolic subsets in CNEOS (dashed lines), and (iii) hyperbolic subsets in the EN catalog (dotted line). The number of bins was calculated based on Sturges’s rule (Sturges 1926).
Current usage metrics show cumulative count of Article Views (full-text article views including HTML views, PDF and ePub downloads, according to the available data) and Abstracts Views on Vision4Press platform.
Data correspond to usage on the plateform after 2015. The current usage metrics is available 48-96 hours after online publication and is updated daily on week days.
Initial download of the metrics may take a while.