Fig. 1.
Download original image
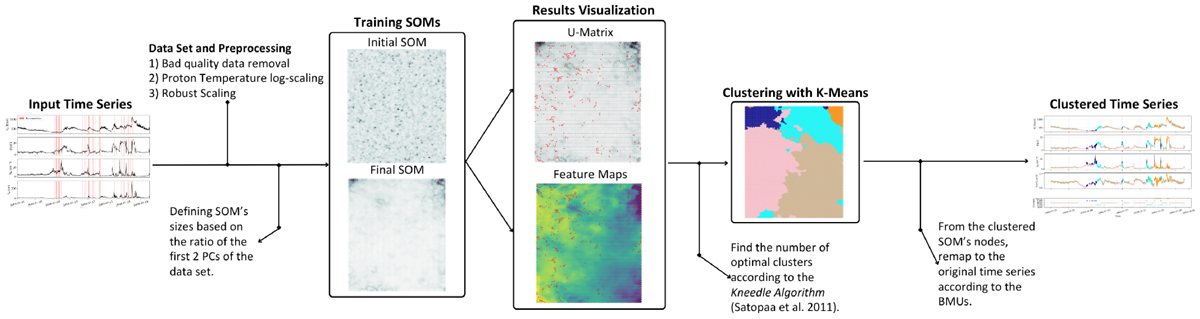
Schematic representation of the workflow. From left to right: The dataset was preprocessed by removing low-quality data and applying robust scaling, and then the SOM was trained on the preprocessed dataset. After this, the K-Means algorithm was applied to the SOM’s nodes to identify distinct clusters within the solar wind data. Solar wind data series are colored according to the cluster we identify.
Current usage metrics show cumulative count of Article Views (full-text article views including HTML views, PDF and ePub downloads, according to the available data) and Abstracts Views on Vision4Press platform.
Data correspond to usage on the plateform after 2015. The current usage metrics is available 48-96 hours after online publication and is updated daily on week days.
Initial download of the metrics may take a while.