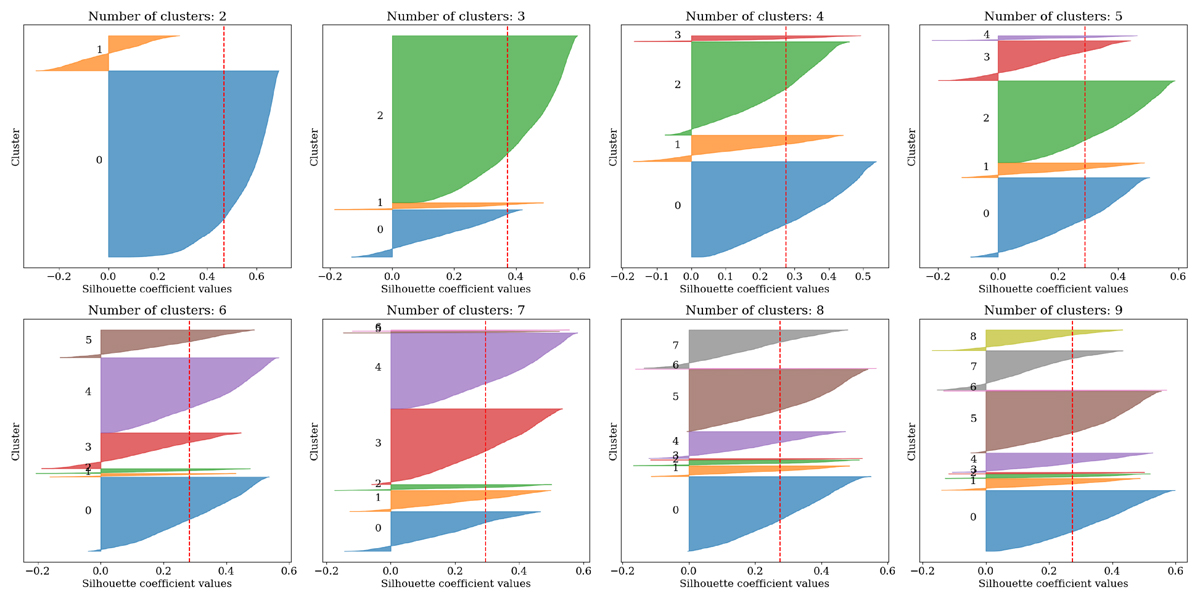
Fig. C.2.
Download original image
Results of the Silhouette analysis of the K-Means clustering of the trained SOM nodes, with different numbers of clusters. Each plot shows the Silhouette scores for each SOM node in each cluster and the average Silhouette score (red dashed). The optimal number of clusters is 5 because all the clusters’ scores are above the average Silhouette score which is greater than the rest of the average scores with different numbers of clusters, excluding the case of K=2, where one cluster (orange) has lower scores than the average and K=3, where two clusters (cyan and orange) are slightly above the average.
Current usage metrics show cumulative count of Article Views (full-text article views including HTML views, PDF and ePub downloads, according to the available data) and Abstracts Views on Vision4Press platform.
Data correspond to usage on the plateform after 2015. The current usage metrics is available 48-96 hours after online publication and is updated daily on week days.
Initial download of the metrics may take a while.