Open Access
Fig. 6.
Download original image
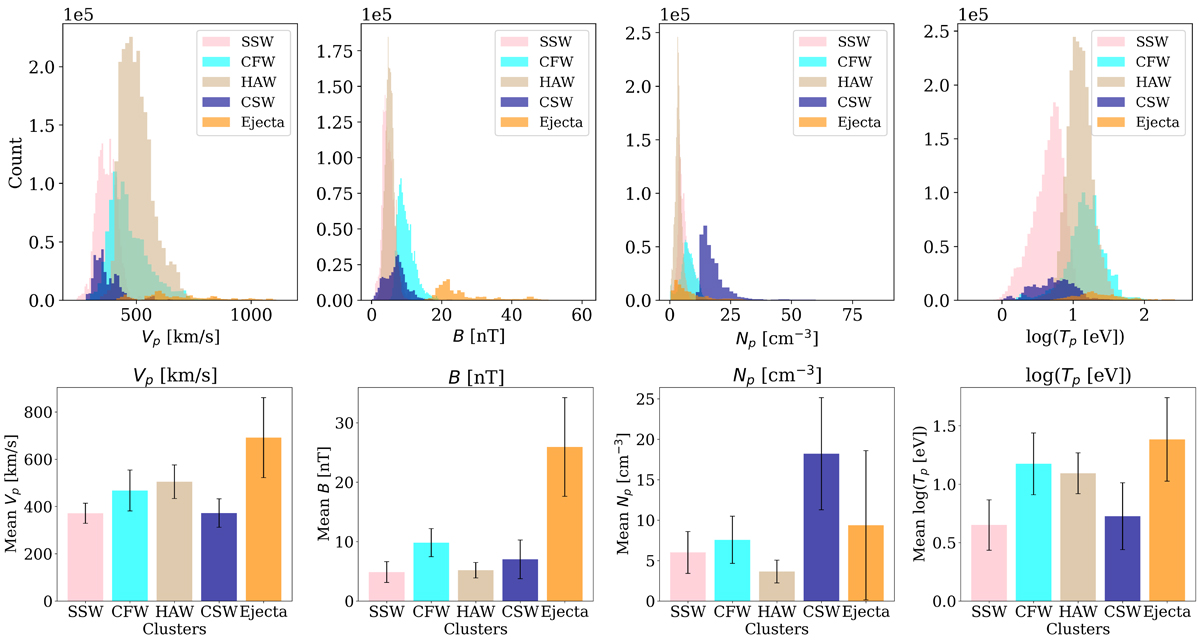
Top: Feature distribution for each cluster. The x axis represents the feature values, while the y axis represents the number of occurrences of that value in the cluster. Bottom: Average values of each feature for each cluster. The error bars represent the standard deviation of the feature values in each cluster.
Current usage metrics show cumulative count of Article Views (full-text article views including HTML views, PDF and ePub downloads, according to the available data) and Abstracts Views on Vision4Press platform.
Data correspond to usage on the plateform after 2015. The current usage metrics is available 48-96 hours after online publication and is updated daily on week days.
Initial download of the metrics may take a while.