Open Access
Fig. 7
Download original image
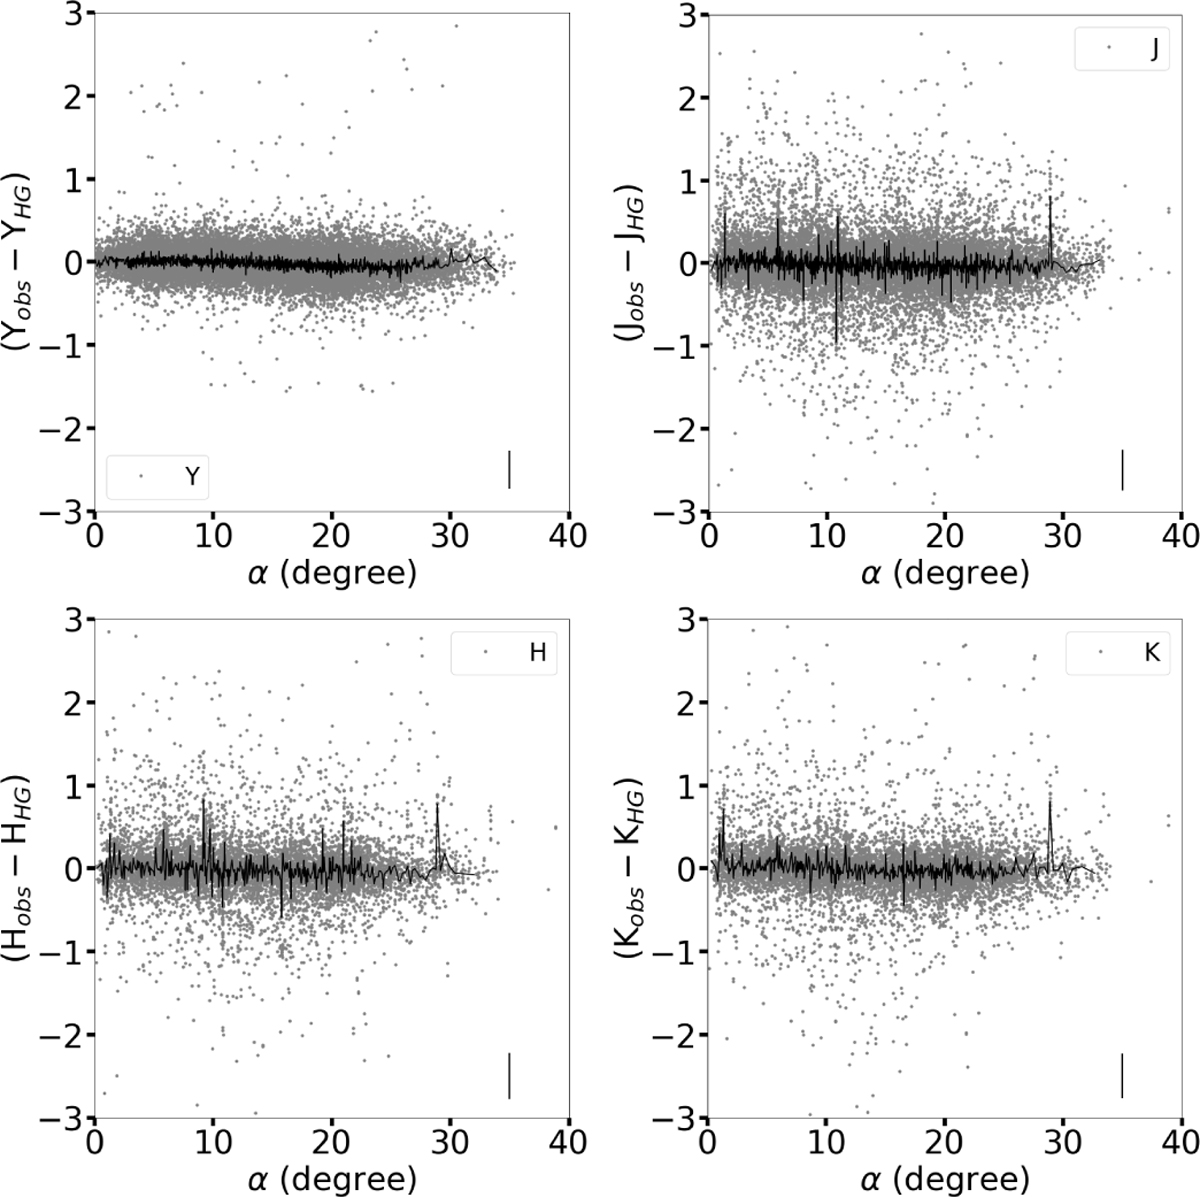
Comparison between measured and modeled magnitudes using the ![]() model. Different panels show data in different filters. The continuous line indicates a running median of 21 points. Typical error bars in the y axis are shown in the lower right corner for reference.
model. Different panels show data in different filters. The continuous line indicates a running median of 21 points. Typical error bars in the y axis are shown in the lower right corner for reference.
Current usage metrics show cumulative count of Article Views (full-text article views including HTML views, PDF and ePub downloads, according to the available data) and Abstracts Views on Vision4Press platform.
Data correspond to usage on the plateform after 2015. The current usage metrics is available 48-96 hours after online publication and is updated daily on week days.
Initial download of the metrics may take a while.