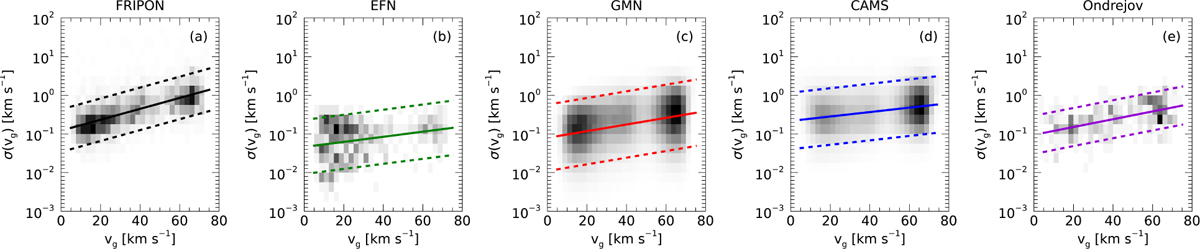
Fig. 1
Download original image
Density maps of values of standard error, σ(υɡ), as function of geocentric speed, υɡ, for databases used in this study (see Table 1). In all panels, the solid coloured line plots the result of a linear fit in the linear-log space, and the dashed coloured lines mark the corresponding prediction band at a 68% confidence level.
Current usage metrics show cumulative count of Article Views (full-text article views including HTML views, PDF and ePub downloads, according to the available data) and Abstracts Views on Vision4Press platform.
Data correspond to usage on the plateform after 2015. The current usage metrics is available 48-96 hours after online publication and is updated daily on week days.
Initial download of the metrics may take a while.