Fig. 2
Download original image
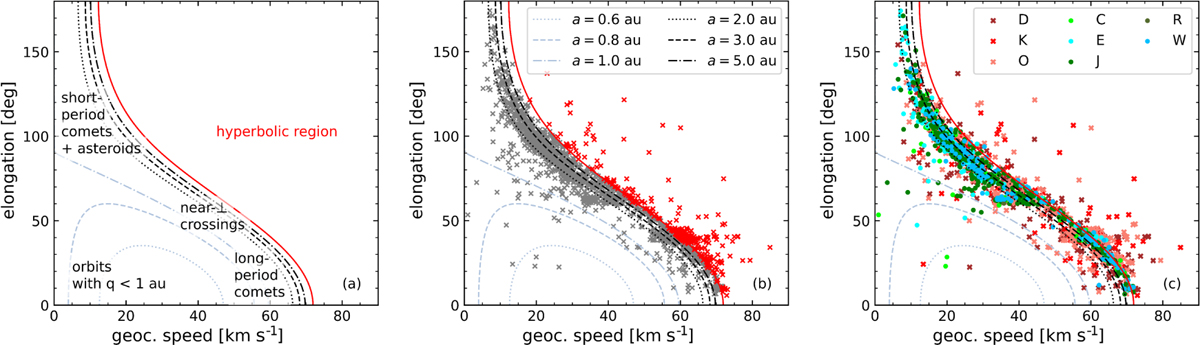
Visualisation of the Kresáks’ diagram, showing relationship between geocentric meteor parameters and resulting heliocentric meteoroid orbits. The different dashed black lines represent orbits with varying values of semi-major axes (see legend of panel b), and the red lines plot the parabolic limit. Panel a displays the position on the Kresáks’ diagram of simplified areas corresponding to the orbit type of each event shown in the graph. Panels b and c demonstrate the approach using older photographic meteors reported in eight IAU MDC catalogues. Panel b represents all photographic catalogues together, with the parabolic limit dividing the diagram into two regions, which are those of meteoroids on elliptical orbits (grey crosses) and hyperbolic orbits (red crosses), showing a continuous spread between the two (Hajduková et al. 2019). Panel c displays the photographic orbits colour-coded according to their respective catalogues and reflecting their data quality. Hereafter, the selected catalogues and their labels in panels b and c are as follows: C – 103 orbits, Ceplecha’s small camera; D – 636 orbits, Dushanbe stations; E – 180 orbits, European Network; J – 413 orbits, Harvard Super Schmidt camera; K – 206 orbits, Kiev stations; O – 459 orbits, Odessa stations; R – 32 orbits, Spanish meteor society; and W – 166 orbits, Harvard small cameras.
Current usage metrics show cumulative count of Article Views (full-text article views including HTML views, PDF and ePub downloads, according to the available data) and Abstracts Views on Vision4Press platform.
Data correspond to usage on the plateform after 2015. The current usage metrics is available 48-96 hours after online publication and is updated daily on week days.
Initial download of the metrics may take a while.