Fig. 3
Download original image
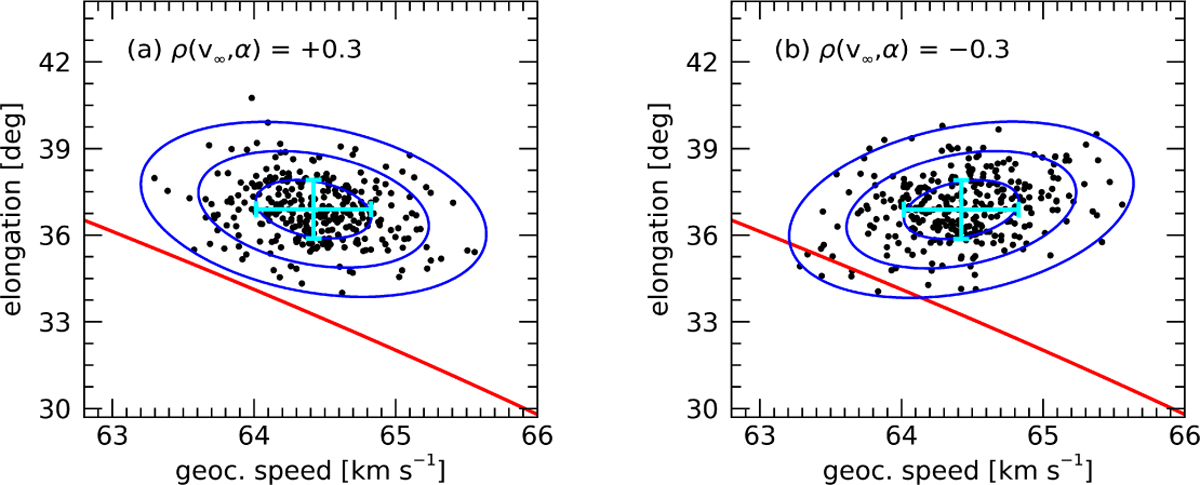
Visualisation of confidence regions for geocentric quantities on the Kresáks’ diagram for two simulated meteors. In both panels, the parameters of the observed meteor were generated as υ∞ = (65.7 ± 0.4) km s−1, α = (153 ± 1)°, and δ = (5 ± 1)°. The corresponding nominal values and standard errors for υɡ and ϵɡ are reported as cyan error bars. The blue ellipses, from inner to outer, show the boundaries of the 1σ, 2σ, and 3σ confidence regions, and the red line plots the parabolic limit. The black dots represent the result of a bootstrap Monte Carlo error propagation for an ensemble of 300 repetitions. The simulation included a covariance matrix element for (υ∞, α) of +0.3 for panel a and of −0.3 for panel b.
Current usage metrics show cumulative count of Article Views (full-text article views including HTML views, PDF and ePub downloads, according to the available data) and Abstracts Views on Vision4Press platform.
Data correspond to usage on the plateform after 2015. The current usage metrics is available 48-96 hours after online publication and is updated daily on week days.
Initial download of the metrics may take a while.