Fig. 5
Download original image
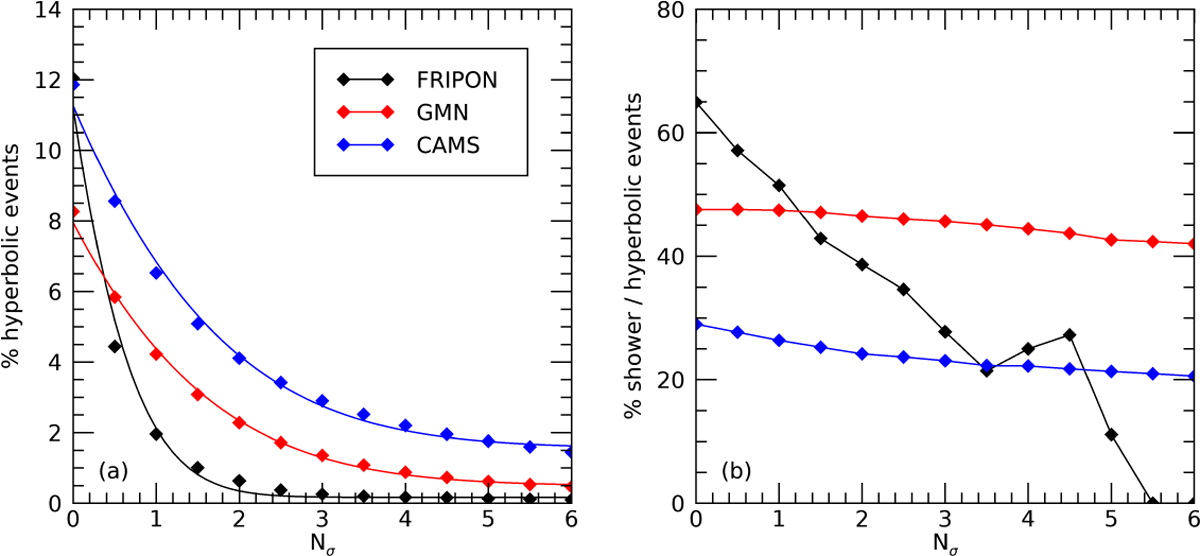
Significance of hyperbolic orbits in the FRIPON, GMN and CAMS meteor databases. Panel a shows the fraction of hyperbolic events as a function of the confidence level expressed as Nσ, which represents the number of standard deviations used to define the confidence interval in the Kresáks’ diagram. The coloured curves represent the fitting of Eq. (3) over the results of each database. Panel b displays the fraction of meteors associated with known meteor showers belonging to the hyperbolic subset as a function of Nσ.
Current usage metrics show cumulative count of Article Views (full-text article views including HTML views, PDF and ePub downloads, according to the available data) and Abstracts Views on Vision4Press platform.
Data correspond to usage on the plateform after 2015. The current usage metrics is available 48-96 hours after online publication and is updated daily on week days.
Initial download of the metrics may take a while.