Fig. 1.
Download original image
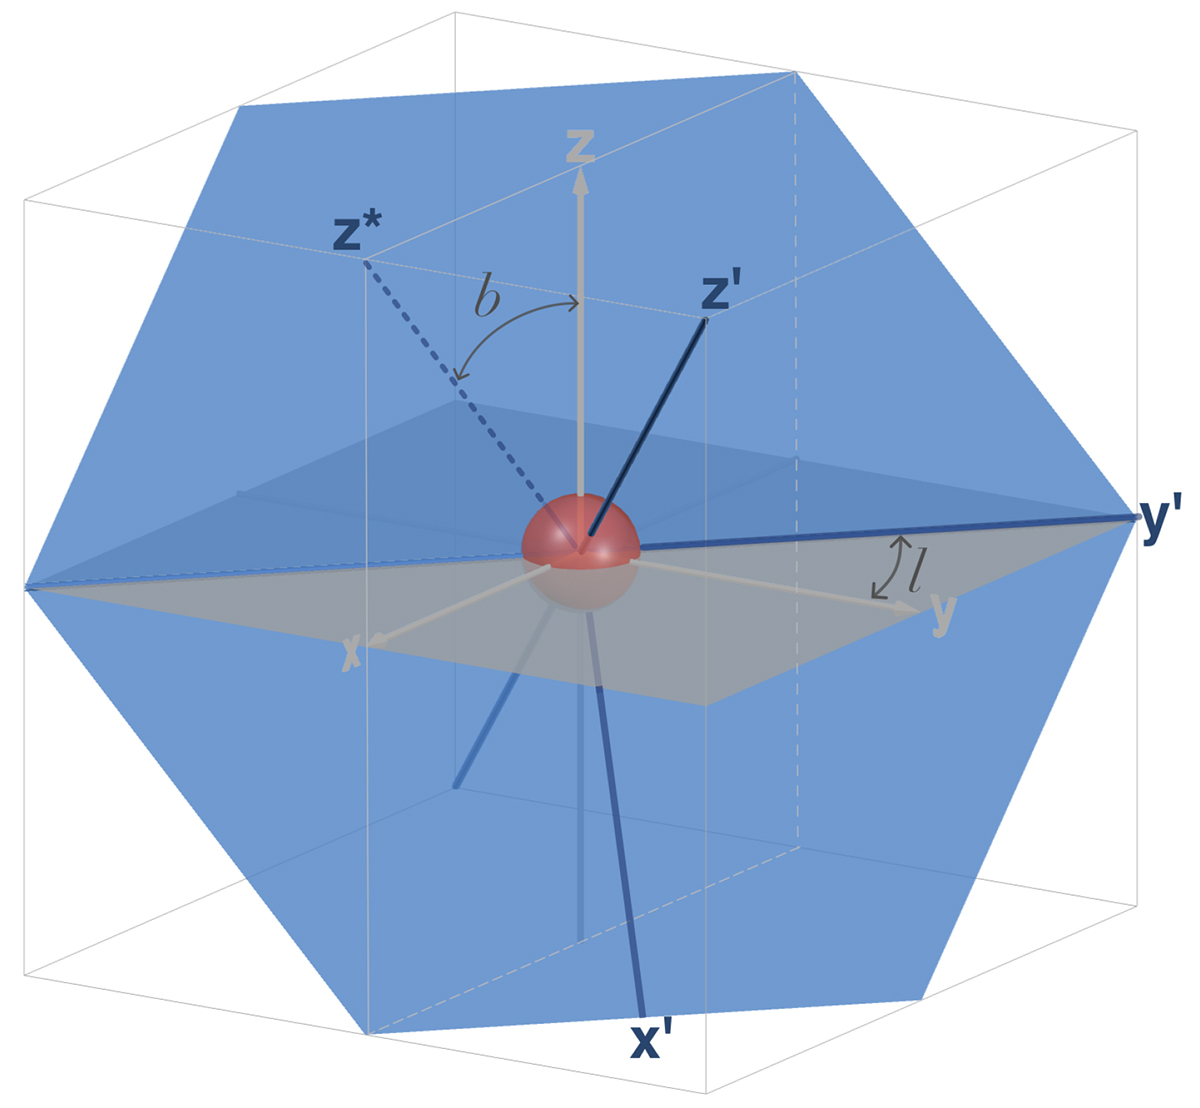
Schematic diagram illustrating the FoMo method for connecting the two grids: the original simulation grid (x, y, z) (gray in the diagram) and the grid (x′,y′,z′) in the observation reference frame (blue in in the diagram). Angle l is around the z-axis and angle b is around the y-axis. The gray and blue planes correspond to the planes perpendicular to the LoS, when it coincides with the z- and z′-axis, respectively. z*-axis in the diagram represents the rotation around y. The red sphere represents the Sun at the center of the coordinate grid.
Current usage metrics show cumulative count of Article Views (full-text article views including HTML views, PDF and ePub downloads, according to the available data) and Abstracts Views on Vision4Press platform.
Data correspond to usage on the plateform after 2015. The current usage metrics is available 48-96 hours after online publication and is updated daily on week days.
Initial download of the metrics may take a while.