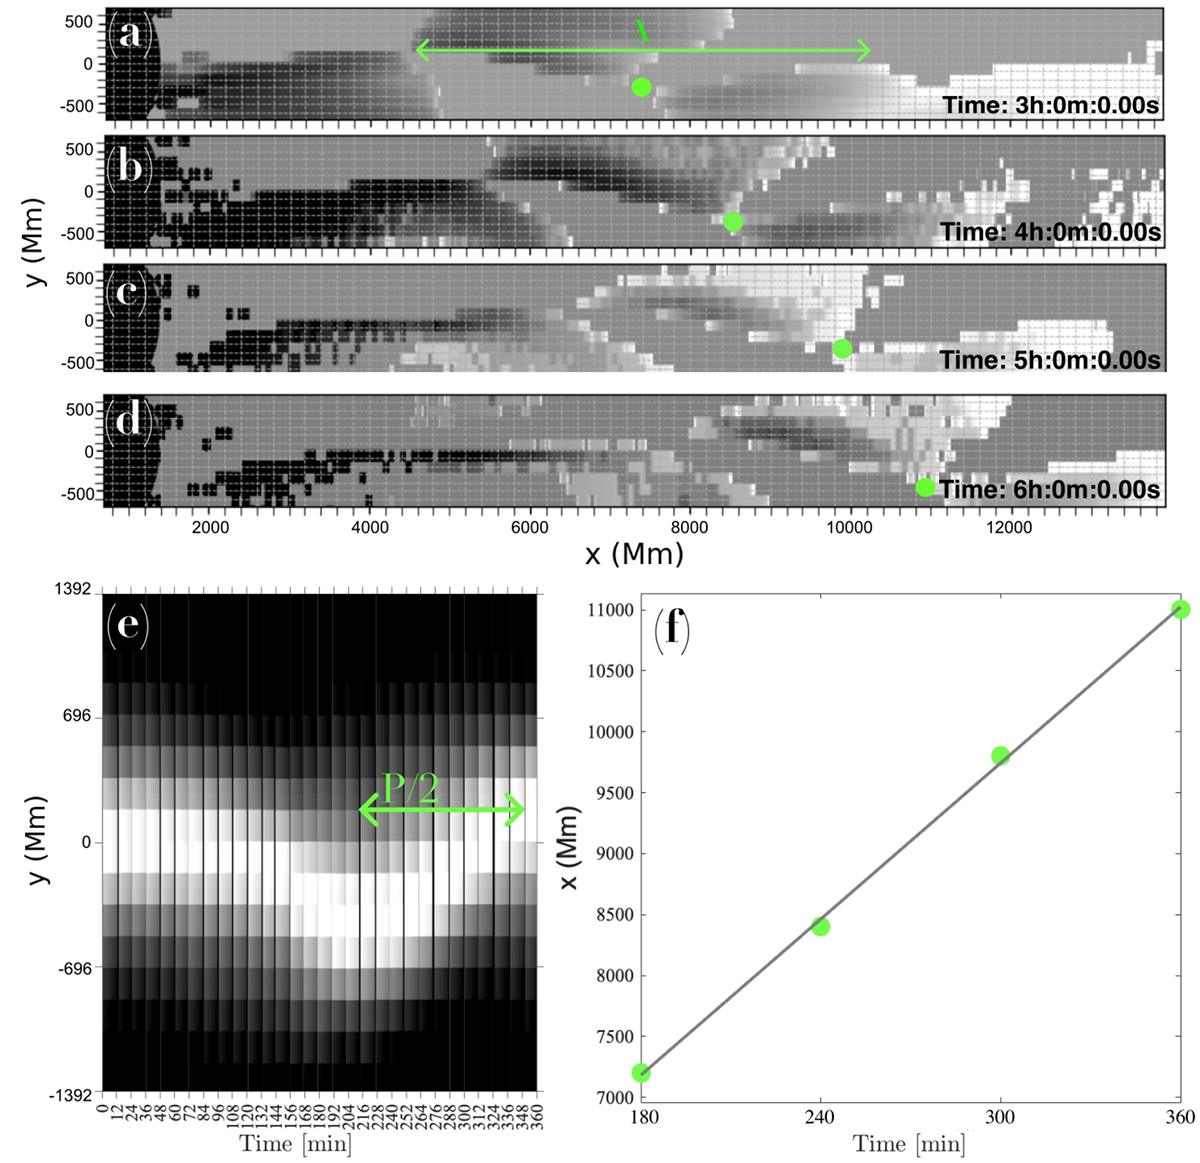
Fig. 10.
Download original image
Panels a–d: Running difference images of the streamer wave event at 03:00:00, 04:00:00, 05:00:00, and 06:00:00 (where 00:00:00 corresponds to the introduction of the perturbation). The green line in panel a shows how we performed the wavelength measurements (λ = 7.5 R⊙). Panel e: Time–distance map along the slit, shown in panel b in Fig. 9. The green line in panel e indicates the half-period measurement (P/2 = 156 min). Panel f: Height–time plot, where the dots correspond to the streamer wave extrema at four times, indicated in panels a-d. The linear fit indicates the measured phase speed (vph = 491 km/s).
Current usage metrics show cumulative count of Article Views (full-text article views including HTML views, PDF and ePub downloads, according to the available data) and Abstracts Views on Vision4Press platform.
Data correspond to usage on the plateform after 2015. The current usage metrics is available 48-96 hours after online publication and is updated daily on week days.
Initial download of the metrics may take a while.