Fig. 2.
Download original image
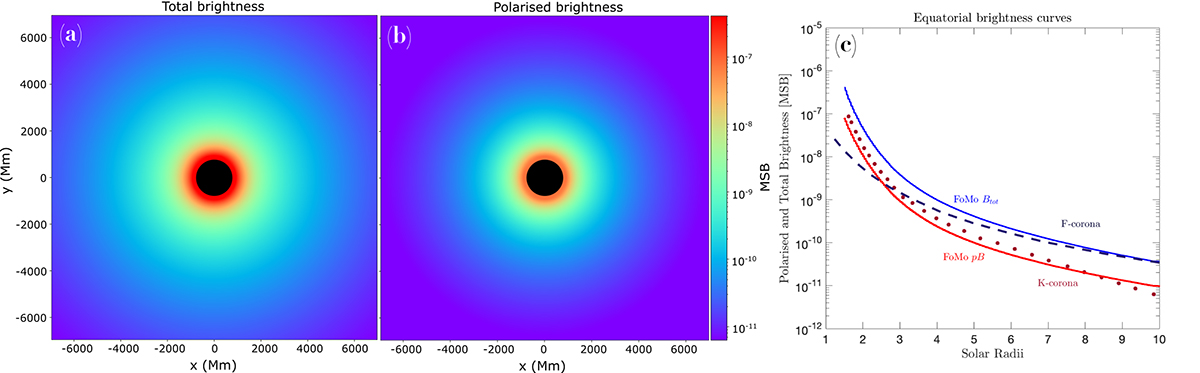
Synthetic images for a spherically symmetric density model, derived in Saito et al. (1977). Panel a: Synthetic total brightness. Panel b: Synthetic polarised brightness. Panel c: Comparison of the computed FoMo total brightness along the equatorial plane (blue line) with the F-corona brightness curve (dark blue dashed line) from Koutchmy & Lamy (1985) and polarised brightness (red line) with the K-corona brightness curve (dotted maroon line) from Saito et al. (1977).
Current usage metrics show cumulative count of Article Views (full-text article views including HTML views, PDF and ePub downloads, according to the available data) and Abstracts Views on Vision4Press platform.
Data correspond to usage on the plateform after 2015. The current usage metrics is available 48-96 hours after online publication and is updated daily on week days.
Initial download of the metrics may take a while.