Fig. 3.
Download original image
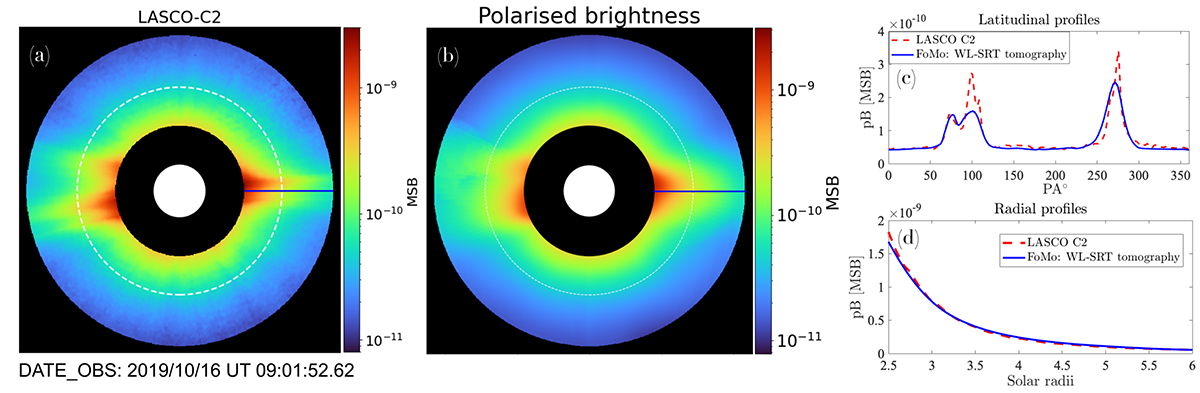
Comparison between the real observational data and synthetic image. Panel a: LASCO C2 observation on 16 October 2019. Panel b: Synthetic image produced with the reconstructed coronal density when the FoV and observation angle match exactly the ones of LASCO C2. Panels c and d: Comparison of the latitudinal and the radial profiles of pB for images in panels a and b.
Current usage metrics show cumulative count of Article Views (full-text article views including HTML views, PDF and ePub downloads, according to the available data) and Abstracts Views on Vision4Press platform.
Data correspond to usage on the plateform after 2015. The current usage metrics is available 48-96 hours after online publication and is updated daily on week days.
Initial download of the metrics may take a while.