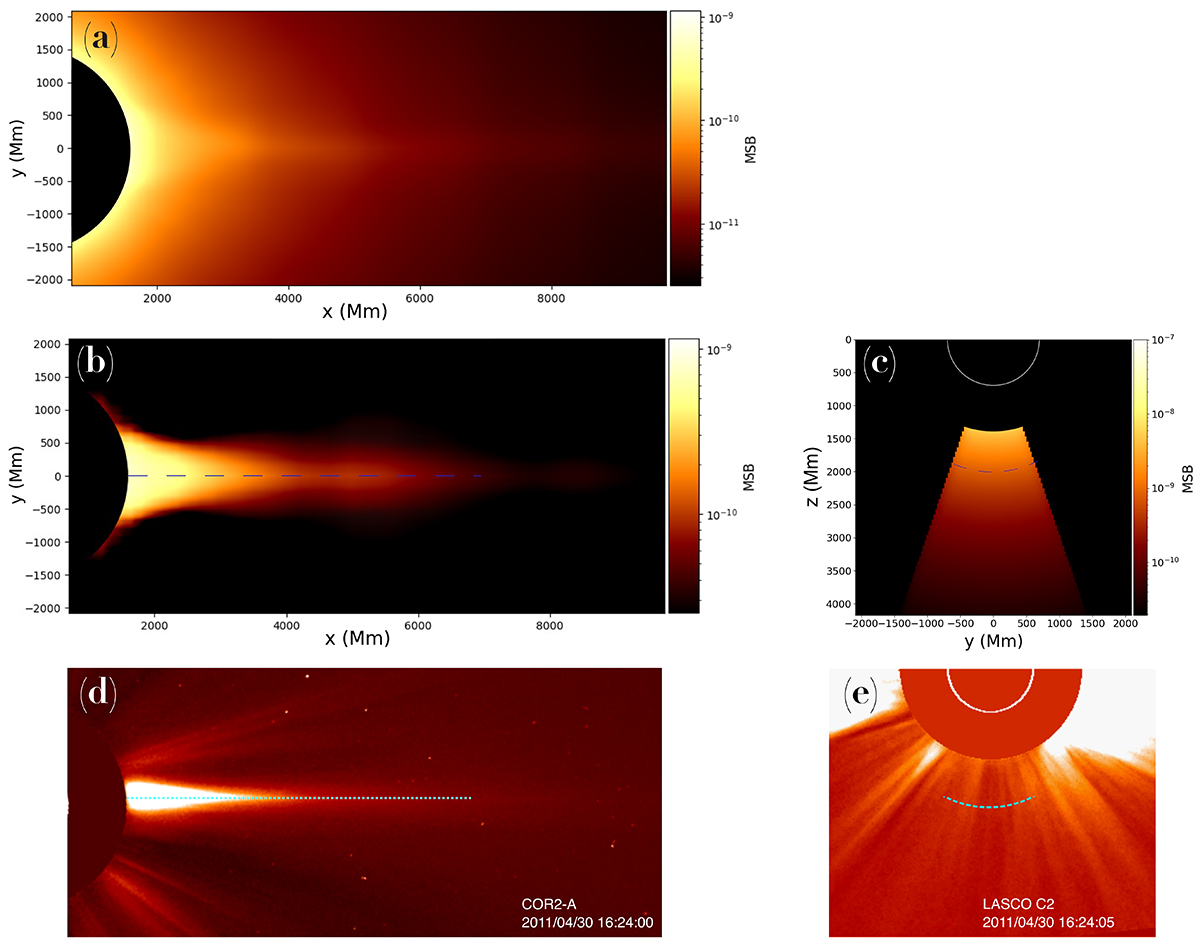
Fig. 7.
Download original image
Comparison between the synthetic and observational data. Panel a: Calculation of the pB from the 3D cylindrical dataset. Panels b and c: Background-subtracted images of the calculated synthetic data for FoVs corresponding to the streamer observations edge-on and face-on, respectively. Panels d and e: Observations on 30 April 2011 from STEREO COR2-A and LASCO C2, respectively. Here, the dark circle represents a patch to mask the distance below 2.0 R⊙.
Current usage metrics show cumulative count of Article Views (full-text article views including HTML views, PDF and ePub downloads, according to the available data) and Abstracts Views on Vision4Press platform.
Data correspond to usage on the plateform after 2015. The current usage metrics is available 48-96 hours after online publication and is updated daily on week days.
Initial download of the metrics may take a while.