Fig. 9.
Download original image
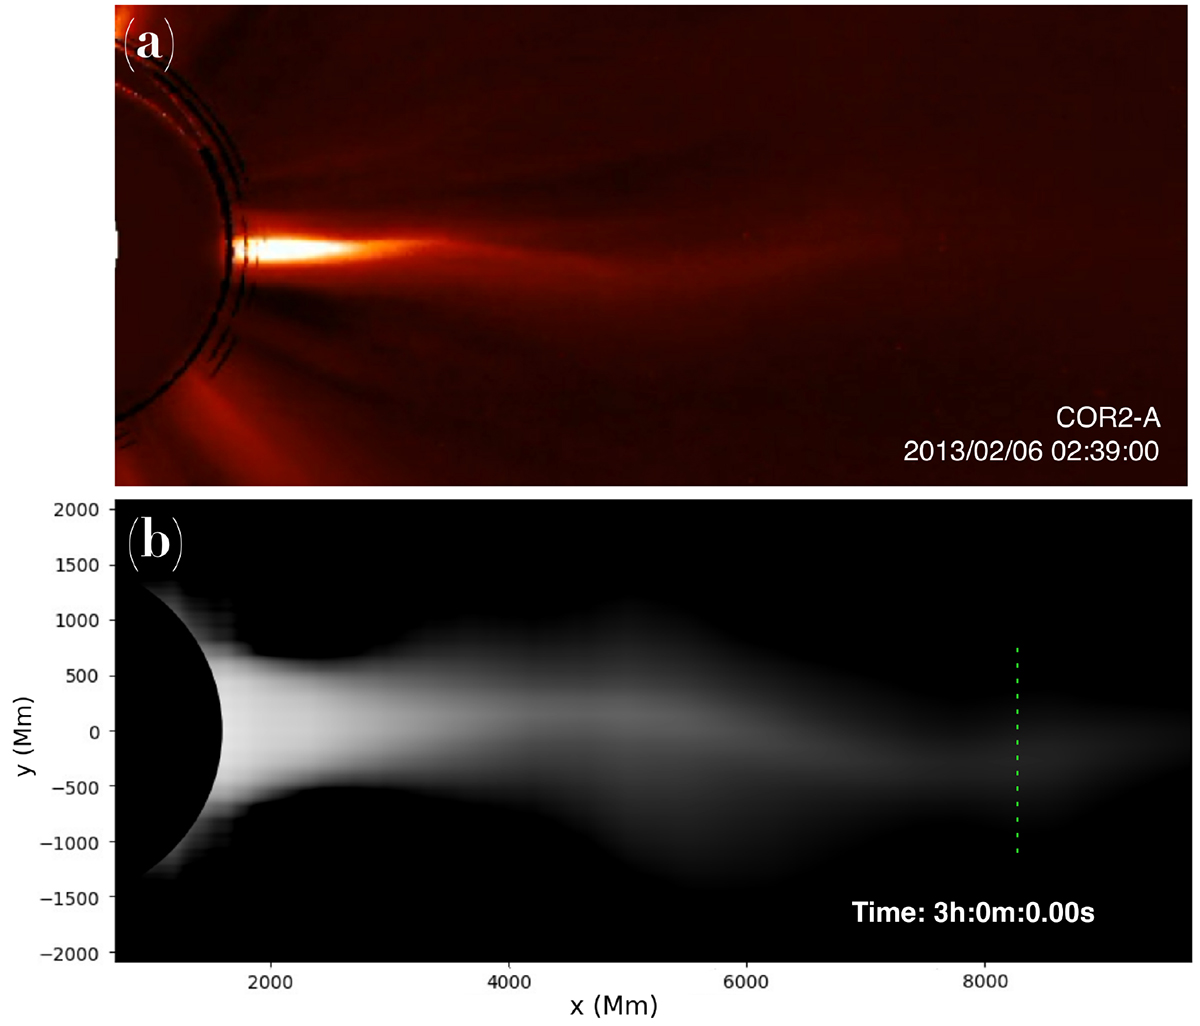
Comparison of the forward modelling results with the observations. Panel a: STEREO A/COR2 white-light image of the streamer wave event on 6 February 2013. Panels b: Synthetic snapshot of the streamer wave propagation, obtained from the density data-cube based on the MHD simulation of the streamer wave phenomena. Here, the dark circle represents a patch to mask the distance below 2.0 R⊙. The associated movie is available online.
Current usage metrics show cumulative count of Article Views (full-text article views including HTML views, PDF and ePub downloads, according to the available data) and Abstracts Views on Vision4Press platform.
Data correspond to usage on the plateform after 2015. The current usage metrics is available 48-96 hours after online publication and is updated daily on week days.
Initial download of the metrics may take a while.