Fig. 10
Download original image
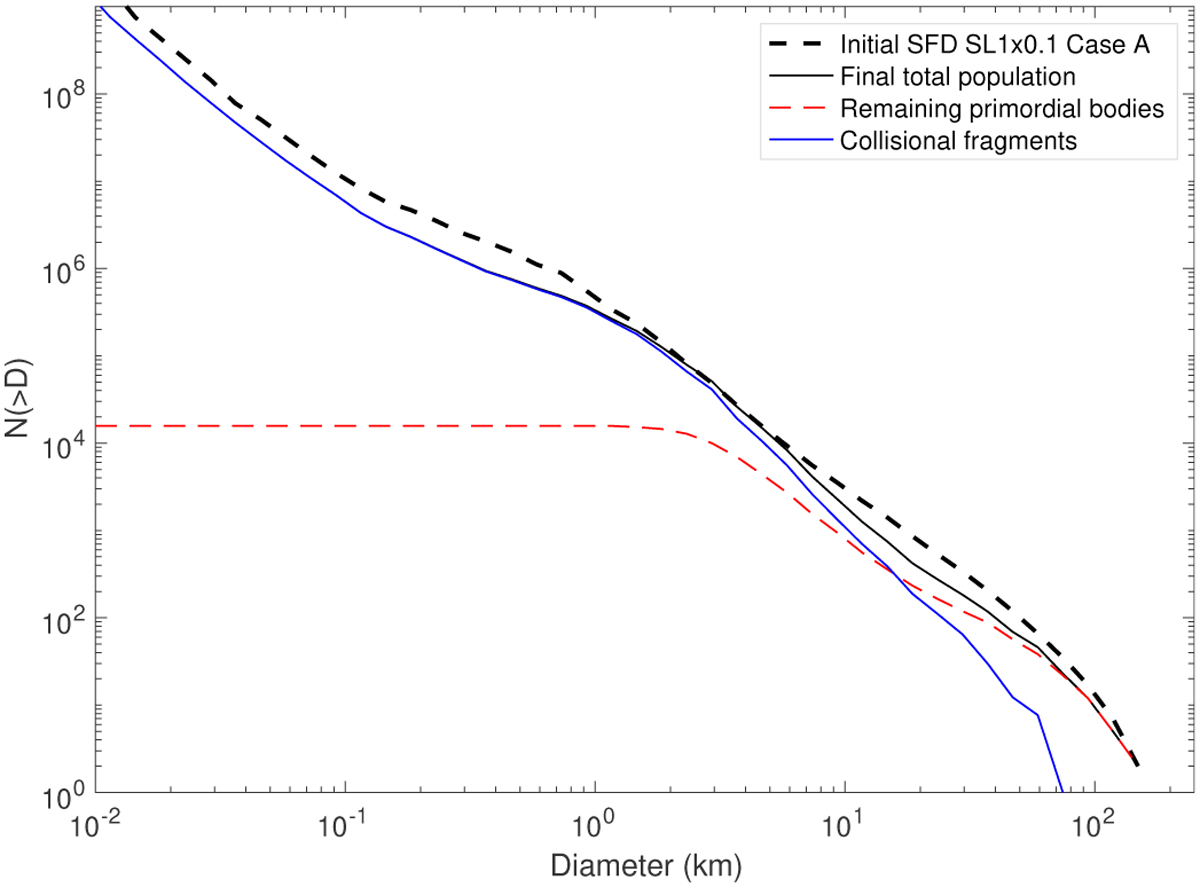
SFDs from our best case run (SL1×0.1, case A). The black dashed line shows the initial SFD of the primordial population at the time of JT emplacement. The solid black line corresponds to the total evolved population after 4 Gyr of collisional evolution. The red line represents the remnant primordial population, while the blue line shows the population of fragments produced during collisions.
Current usage metrics show cumulative count of Article Views (full-text article views including HTML views, PDF and ePub downloads, according to the available data) and Abstracts Views on Vision4Press platform.
Data correspond to usage on the plateform after 2015. The current usage metrics is available 48-96 hours after online publication and is updated daily on week days.
Initial download of the metrics may take a while.