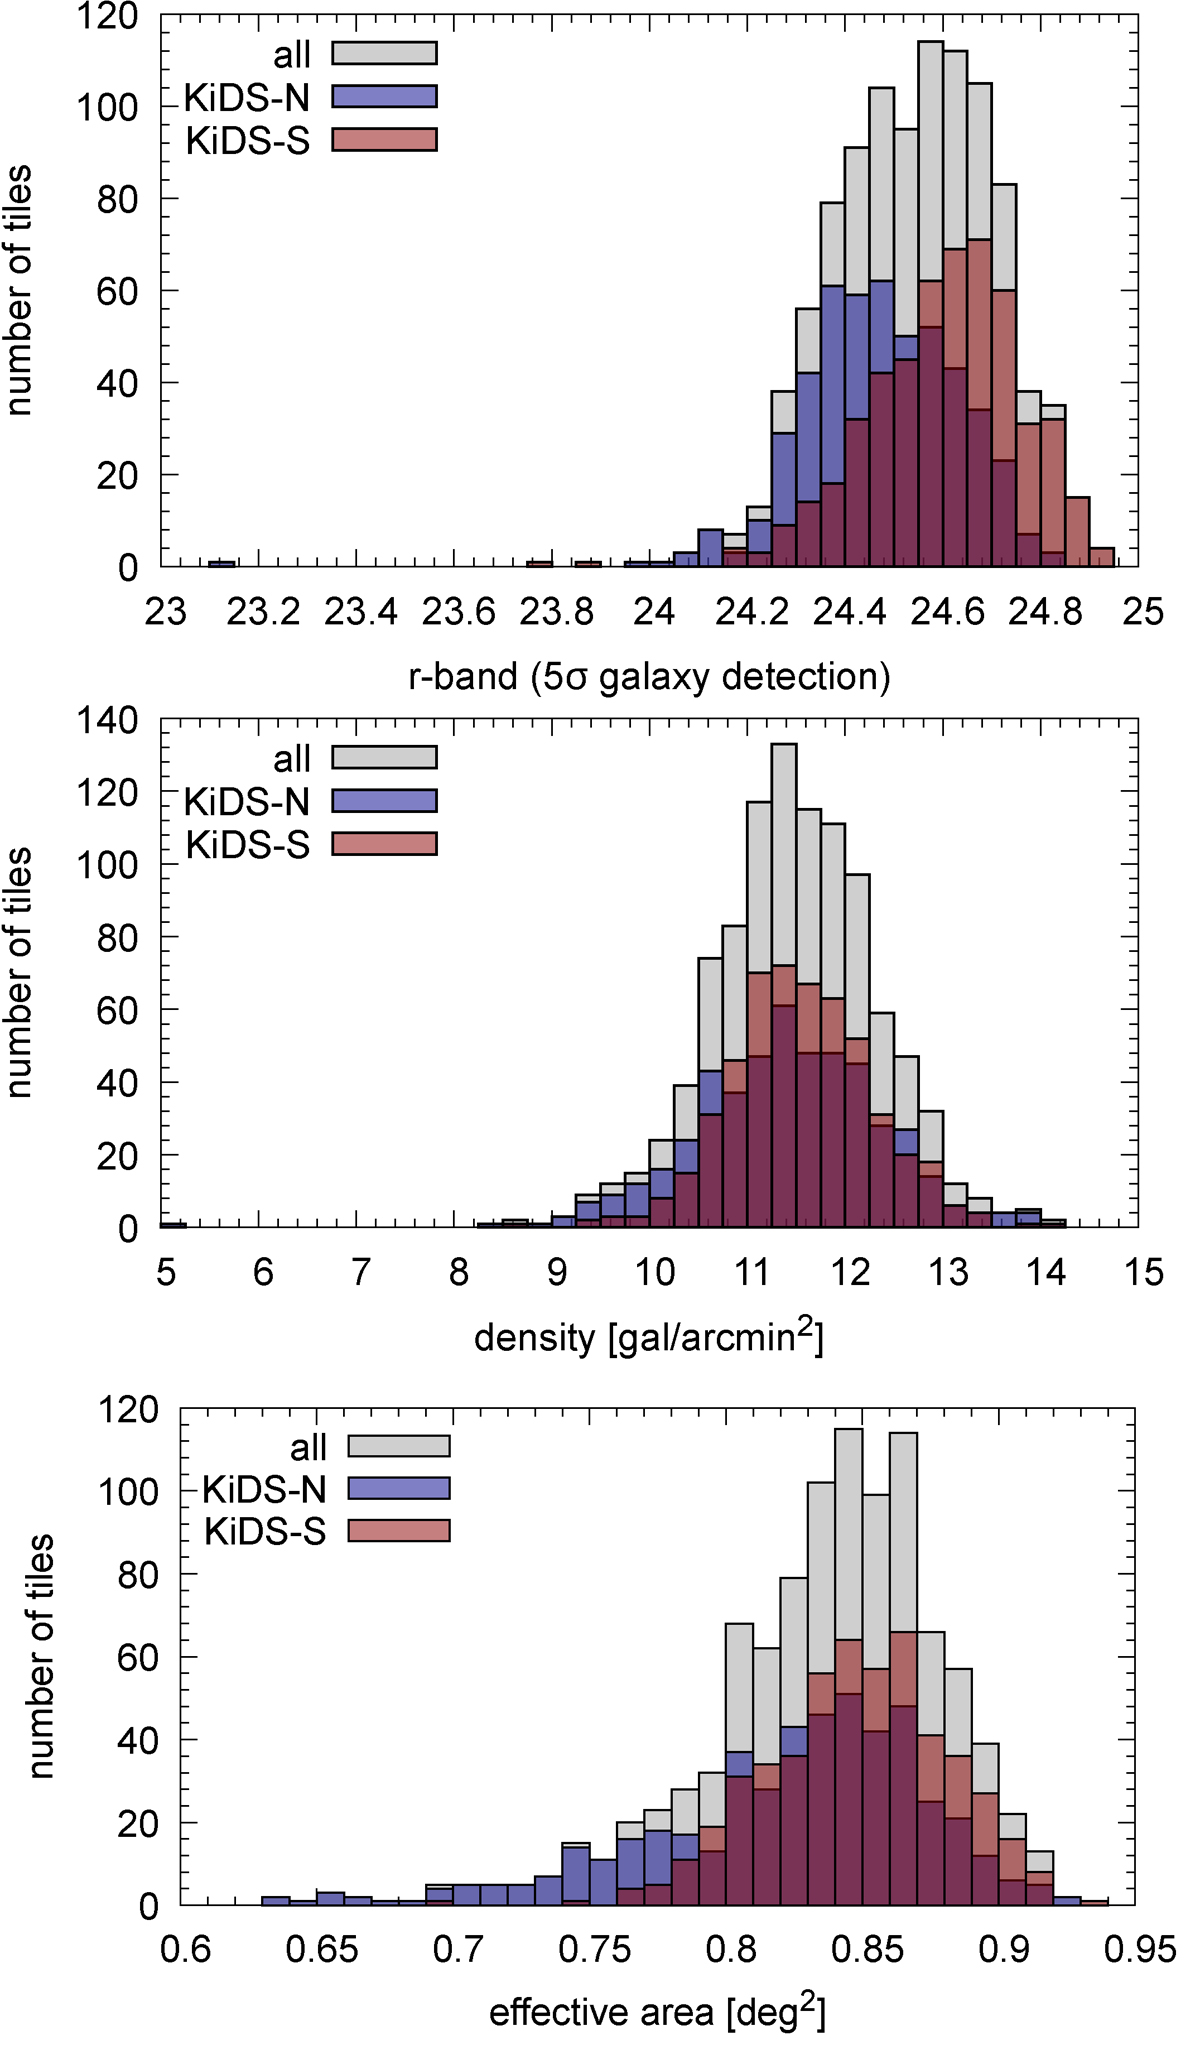
Fig. 1.
Download original image
Key statistical properties for each individual tile of the KiDS-DR4 dataset. Gray, blue and red histograms refer to the entire dataset, to the KiDS-N and KiDS-S stripes, respectively. The distribution of the survey depth in the r-band, the galaxy number density per arcmin2, and the effective area of each tile are shown in top, central, and bottom panels, respectively.
Current usage metrics show cumulative count of Article Views (full-text article views including HTML views, PDF and ePub downloads, according to the available data) and Abstracts Views on Vision4Press platform.
Data correspond to usage on the plateform after 2015. The current usage metrics is available 48-96 hours after online publication and is updated daily on week days.
Initial download of the metrics may take a while.