Fig. 10.
Download original image
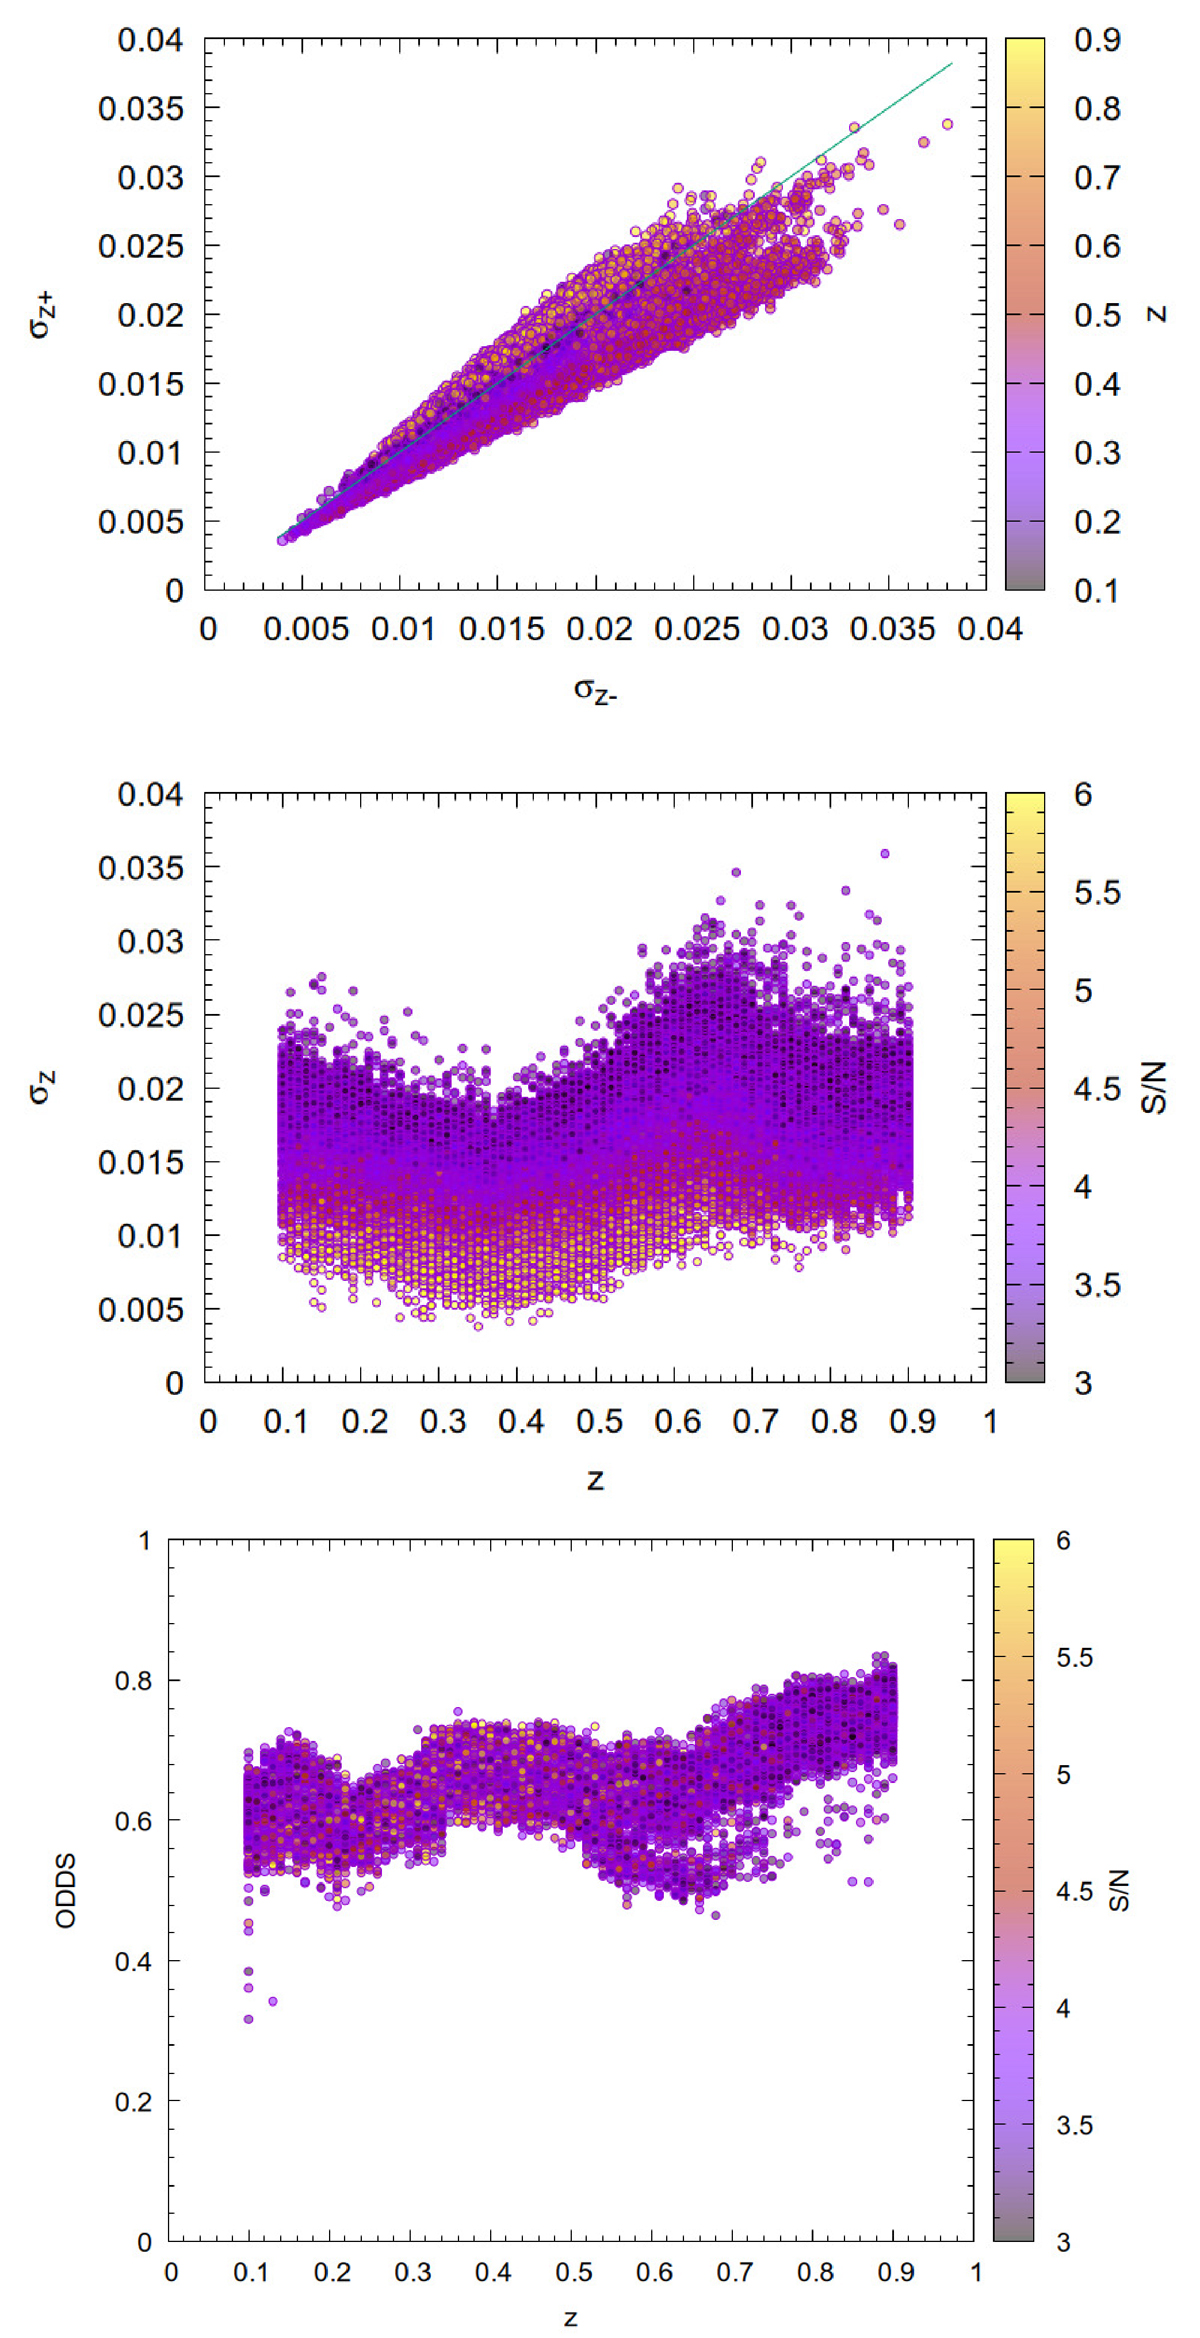
Top panel: Upper and lower 67% percentile limits of the redshift probability distribution, Pdet(z), for each cluster detection. Central panel: Redshift uncertainty derived from the previous percentiles. Bottom panel: ODDS values, where it is possible to notice that a subpopulation of detections in the redshift range 0.5 < z < 0.75 exhibits significantly lower ODDS values compared to the other detections. Data are colored according to their redshift in the upper panel and according to S/N in the other two panels.
Current usage metrics show cumulative count of Article Views (full-text article views including HTML views, PDF and ePub downloads, according to the available data) and Abstracts Views on Vision4Press platform.
Data correspond to usage on the plateform after 2015. The current usage metrics is available 48-96 hours after online publication and is updated daily on week days.
Initial download of the metrics may take a while.