Fig. 12.
Download original image
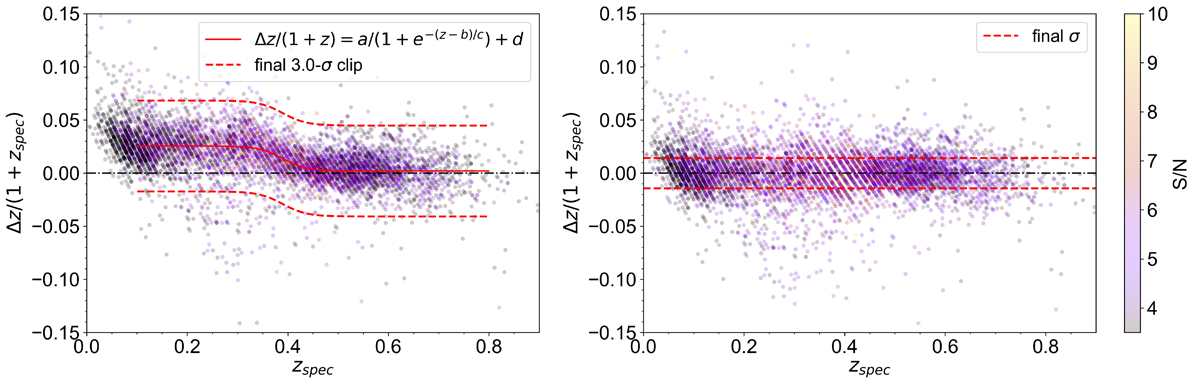
Scatter of the detections’ redshifts obtained with AMICO (based on galaxy photo-zs) with respect to the corresponding spectroscopic redshifts. Left and right panels show the values before and after redshift calibration, respectively. The left panel also displays the associated bias model (red solid line) and the final limits used for the k-sigma clipping (dashed red line). In the right panel, the dashed red lines show the final 1σ uncertainty.
Current usage metrics show cumulative count of Article Views (full-text article views including HTML views, PDF and ePub downloads, according to the available data) and Abstracts Views on Vision4Press platform.
Data correspond to usage on the plateform after 2015. The current usage metrics is available 48-96 hours after online publication and is updated daily on week days.
Initial download of the metrics may take a while.