Fig. 17.
Download original image
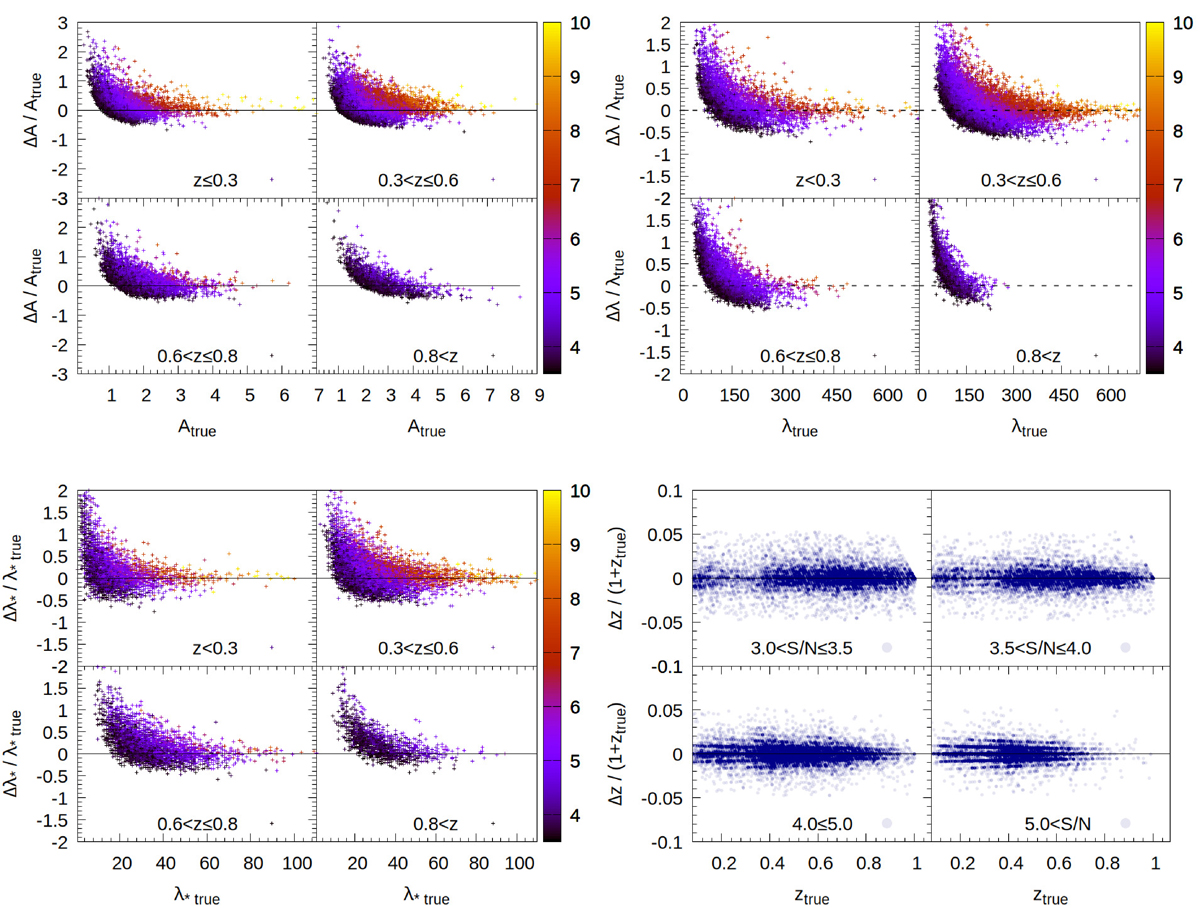
Scatter plots comparing the mock measured versus mock true values (e.g., Δλ = λobs − λtrue) of amplitude, A (top-left panels); apparent richness, λ (top-right panels); intrinsic richness, λ* (bottom-left panels); and redshift, z (bottom-right panels). Each analysis is presented for four different bins in redshift, as labeled in each subpanel. The color bars refer to different values of S/N.
Current usage metrics show cumulative count of Article Views (full-text article views including HTML views, PDF and ePub downloads, according to the available data) and Abstracts Views on Vision4Press platform.
Data correspond to usage on the plateform after 2015. The current usage metrics is available 48-96 hours after online publication and is updated daily on week days.
Initial download of the metrics may take a while.