Open Access
Fig. 19.
Download original image
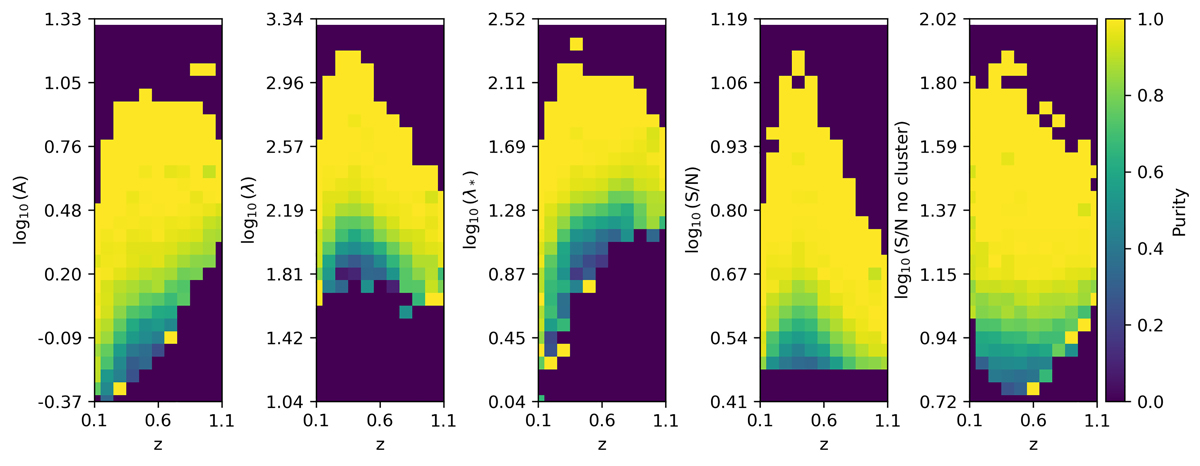
Sample purity derived from the SINFONIA mocks as a function of true redshift and various observables. From left to right, the different panels refer to amplitude, A; intrinsic richness, λ*; observed richness, λ; signal-to-noise ratio, S/N; and signal-to-noise ratio excluding the shot noise contribution from clusters.
Current usage metrics show cumulative count of Article Views (full-text article views including HTML views, PDF and ePub downloads, according to the available data) and Abstracts Views on Vision4Press platform.
Data correspond to usage on the plateform after 2015. The current usage metrics is available 48-96 hours after online publication and is updated daily on week days.
Initial download of the metrics may take a while.