Open Access
Fig. 2.
Download original image
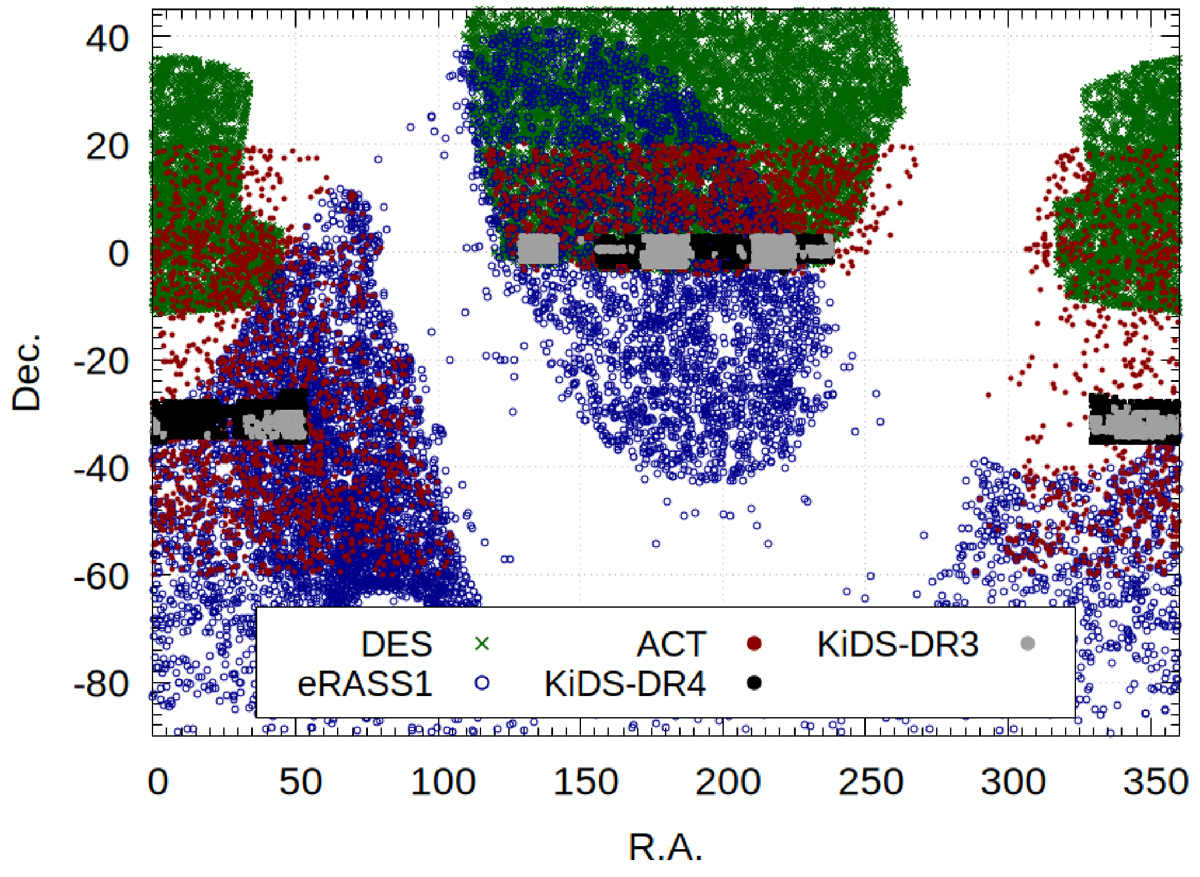
Footprint of KiDS-DR4 data (black area) overlapped by KiDS-DR3 data (gray area), showing the increase in area coverage. For comparison, the RedMaPPer-DES (green crosses), eRASS1 (blue circles) and ACR-DR5 (red points) cluster samples are also shown.
Current usage metrics show cumulative count of Article Views (full-text article views including HTML views, PDF and ePub downloads, according to the available data) and Abstracts Views on Vision4Press platform.
Data correspond to usage on the plateform after 2015. The current usage metrics is available 48-96 hours after online publication and is updated daily on week days.
Initial download of the metrics may take a while.