Fig. 20.
Download original image
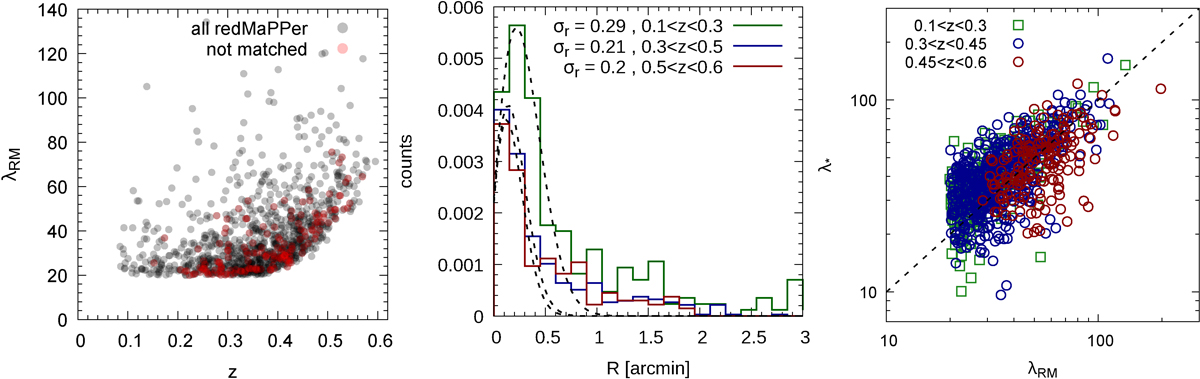
Left panel: Distribution in the richness-redshift plane of all RedMaPPer detections present in the KiDS effective area. Objects with no AMICO counterpart are displayed in red. Central panel: Distribution of the angular displacement between the centers of the matched detections between the RedMaPPer and AMICO samples for three different redshift intervals. The best-fit Rayleigh distributions are shown as dashed lines; the values of their corresponding σr are also reported in the legend. Right panel: Comparison between the RedMaPPer richness, λRM, and the AMICO intrinsic richness, λ*, for the matched objects. Data are color coded according to three different redshift intervals. The dashed line indicates the equality line.
Current usage metrics show cumulative count of Article Views (full-text article views including HTML views, PDF and ePub downloads, according to the available data) and Abstracts Views on Vision4Press platform.
Data correspond to usage on the plateform after 2015. The current usage metrics is available 48-96 hours after online publication and is updated daily on week days.
Initial download of the metrics may take a while.