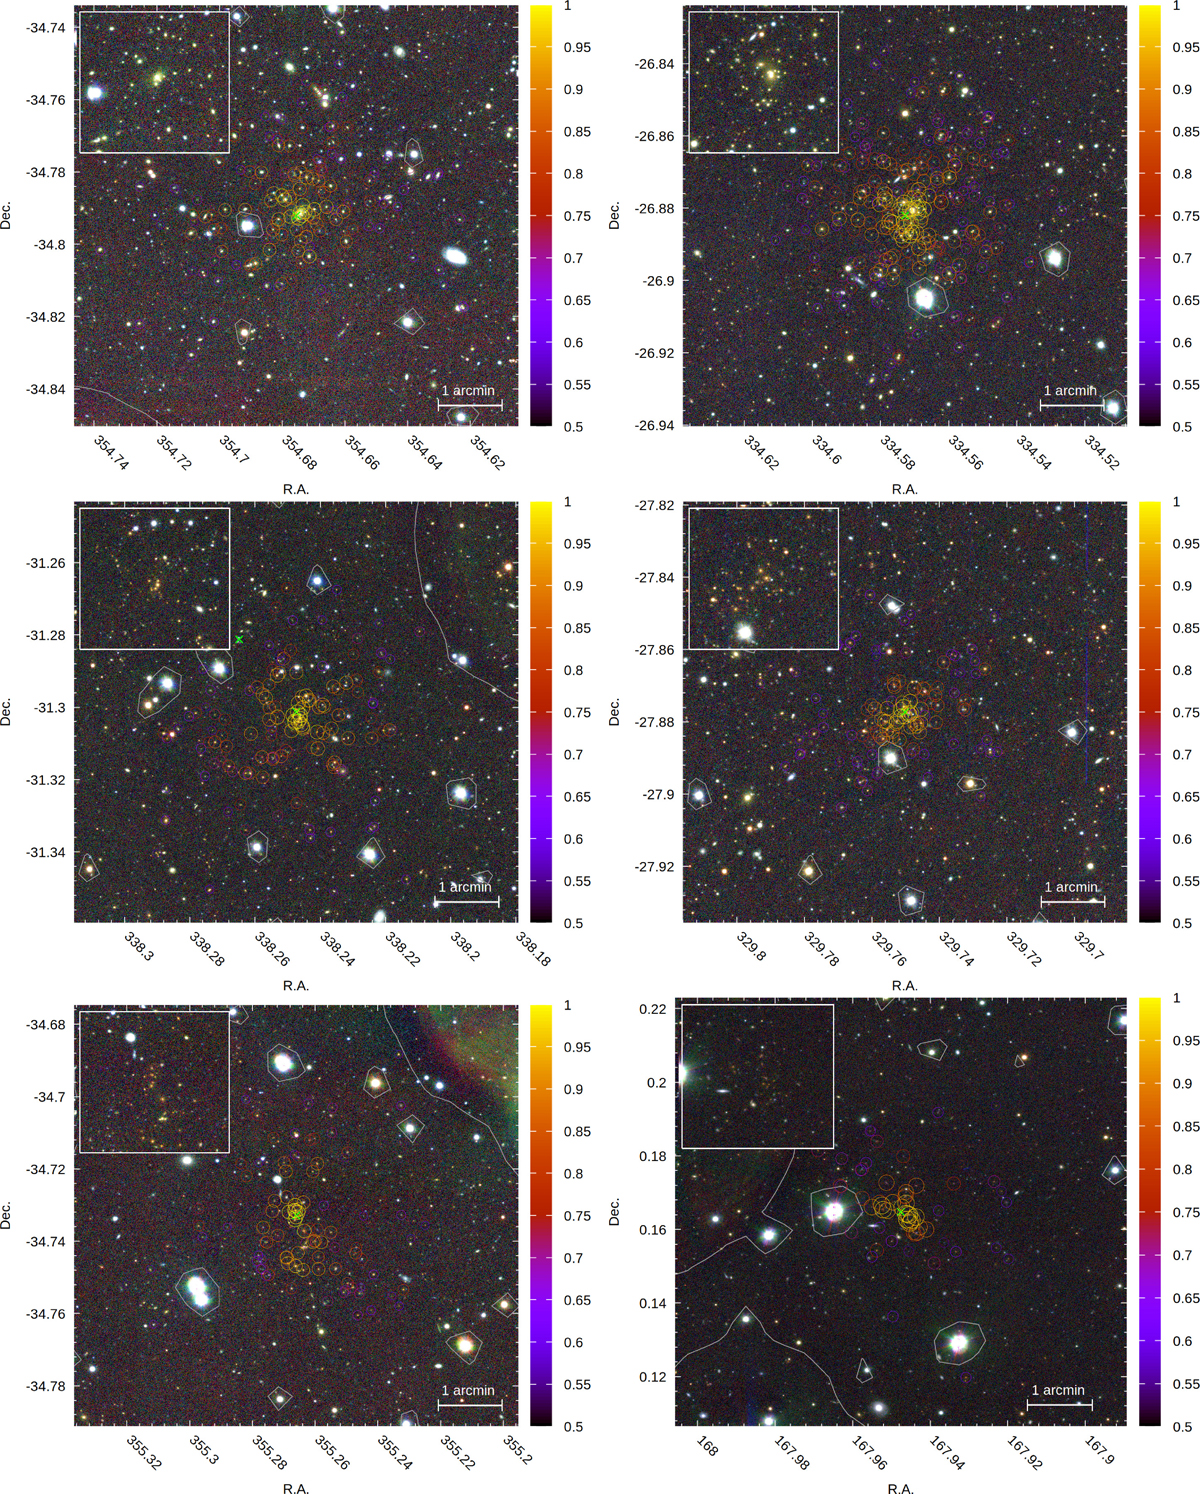
Fig. A.1.
Download original image
Gallery showcasing a selection of newly discovered clusters with λ* > 60. The images are arranged from left to right and top to bottom, following the order of the entries in Table A.1. The cluster center is marked with a green “x”, while cluster members are highlighted with circles, with colors indicating their probabilistic membership. The top-left subpanels provide a zoomed-in view of the central region without overlays. Each postage stamp image covers an area of 7 arcmin per side.
Current usage metrics show cumulative count of Article Views (full-text article views including HTML views, PDF and ePub downloads, according to the available data) and Abstracts Views on Vision4Press platform.
Data correspond to usage on the plateform after 2015. The current usage metrics is available 48-96 hours after online publication and is updated daily on week days.
Initial download of the metrics may take a while.