Fig. 4.
Download original image
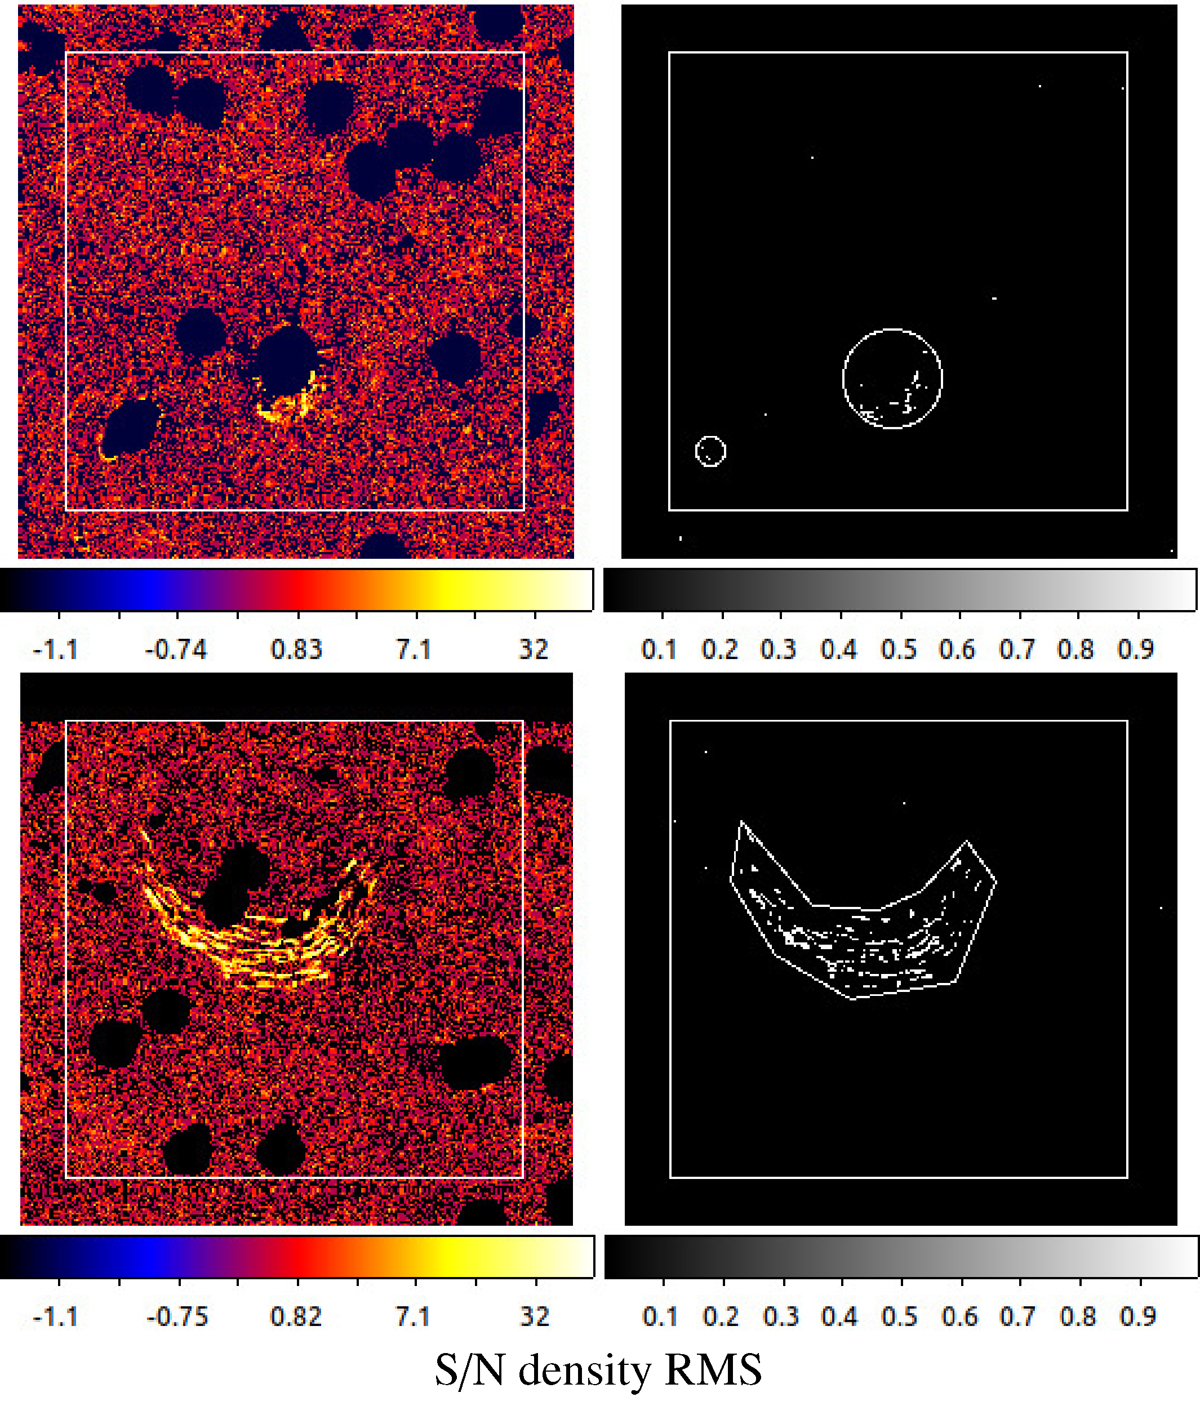
Fluctuations of the spatial number density of galaxy catalog entries relative to its background rms, farti, for the KiDS_DR4.0_185.0_-0.5 (top left) and KiDS_DR4.0_218.6_2.5 (bottom left) tiles, which are the best and worst tiles listed in Table 1, respectively. The values are shown using a logarithmic scale, shown below the panels. Pixels with farti > 10 are used to create additional masks to identify image artifacts, as displayed in the corresponding right panels. The displayed areas are 1.4 deg on each side. The white square box enclosing most of the area marks the boundary of the survey tile, while the other white contours indicate examples of the handmade polygons enclosing the largest artifacts.
Table 1.
List of tiles where the cosmetic artifacts cover an area larger than 5 arcmin2. Tile ID identifies the tile name, whereas Aarti is the area covered by artifacts in square arcminutes.
Current usage metrics show cumulative count of Article Views (full-text article views including HTML views, PDF and ePub downloads, according to the available data) and Abstracts Views on Vision4Press platform.
Data correspond to usage on the plateform after 2015. The current usage metrics is available 48-96 hours after online publication and is updated daily on week days.
Initial download of the metrics may take a while.