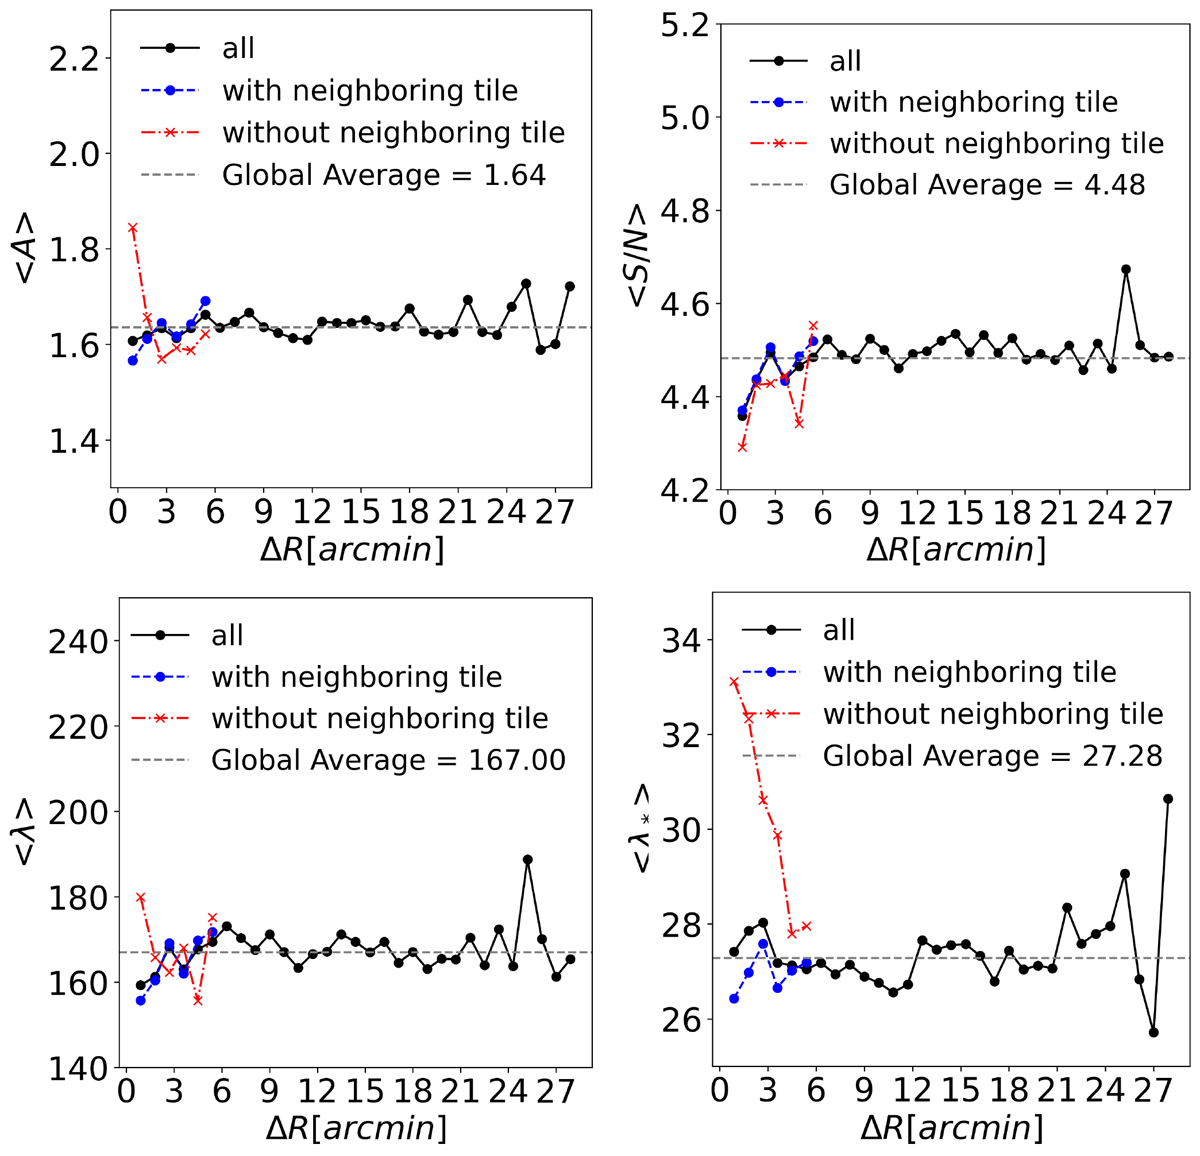
Fig. 6.
Download original image
Average properties of detections as a function of their distance from the tile border, ΔR: amplitude, A (top-left panel); signal-to-noise ratio, S/N (top-right panel), apparent richness, λ (bottom left); and intrinsic richness, λ* (bottom right). The results for all detections are shown in black. Those within 5 arcmin of a tile border having a neighboring tile are shown in blue, and those with a missing neighboring tile are shown in red. Most values are insensitive to the tiling scheme, except for λ* near the survey’s external borders and in regions with missing tiles within the overall area.
Current usage metrics show cumulative count of Article Views (full-text article views including HTML views, PDF and ePub downloads, according to the available data) and Abstracts Views on Vision4Press platform.
Data correspond to usage on the plateform after 2015. The current usage metrics is available 48-96 hours after online publication and is updated daily on week days.
Initial download of the metrics may take a while.