Fig. 8.
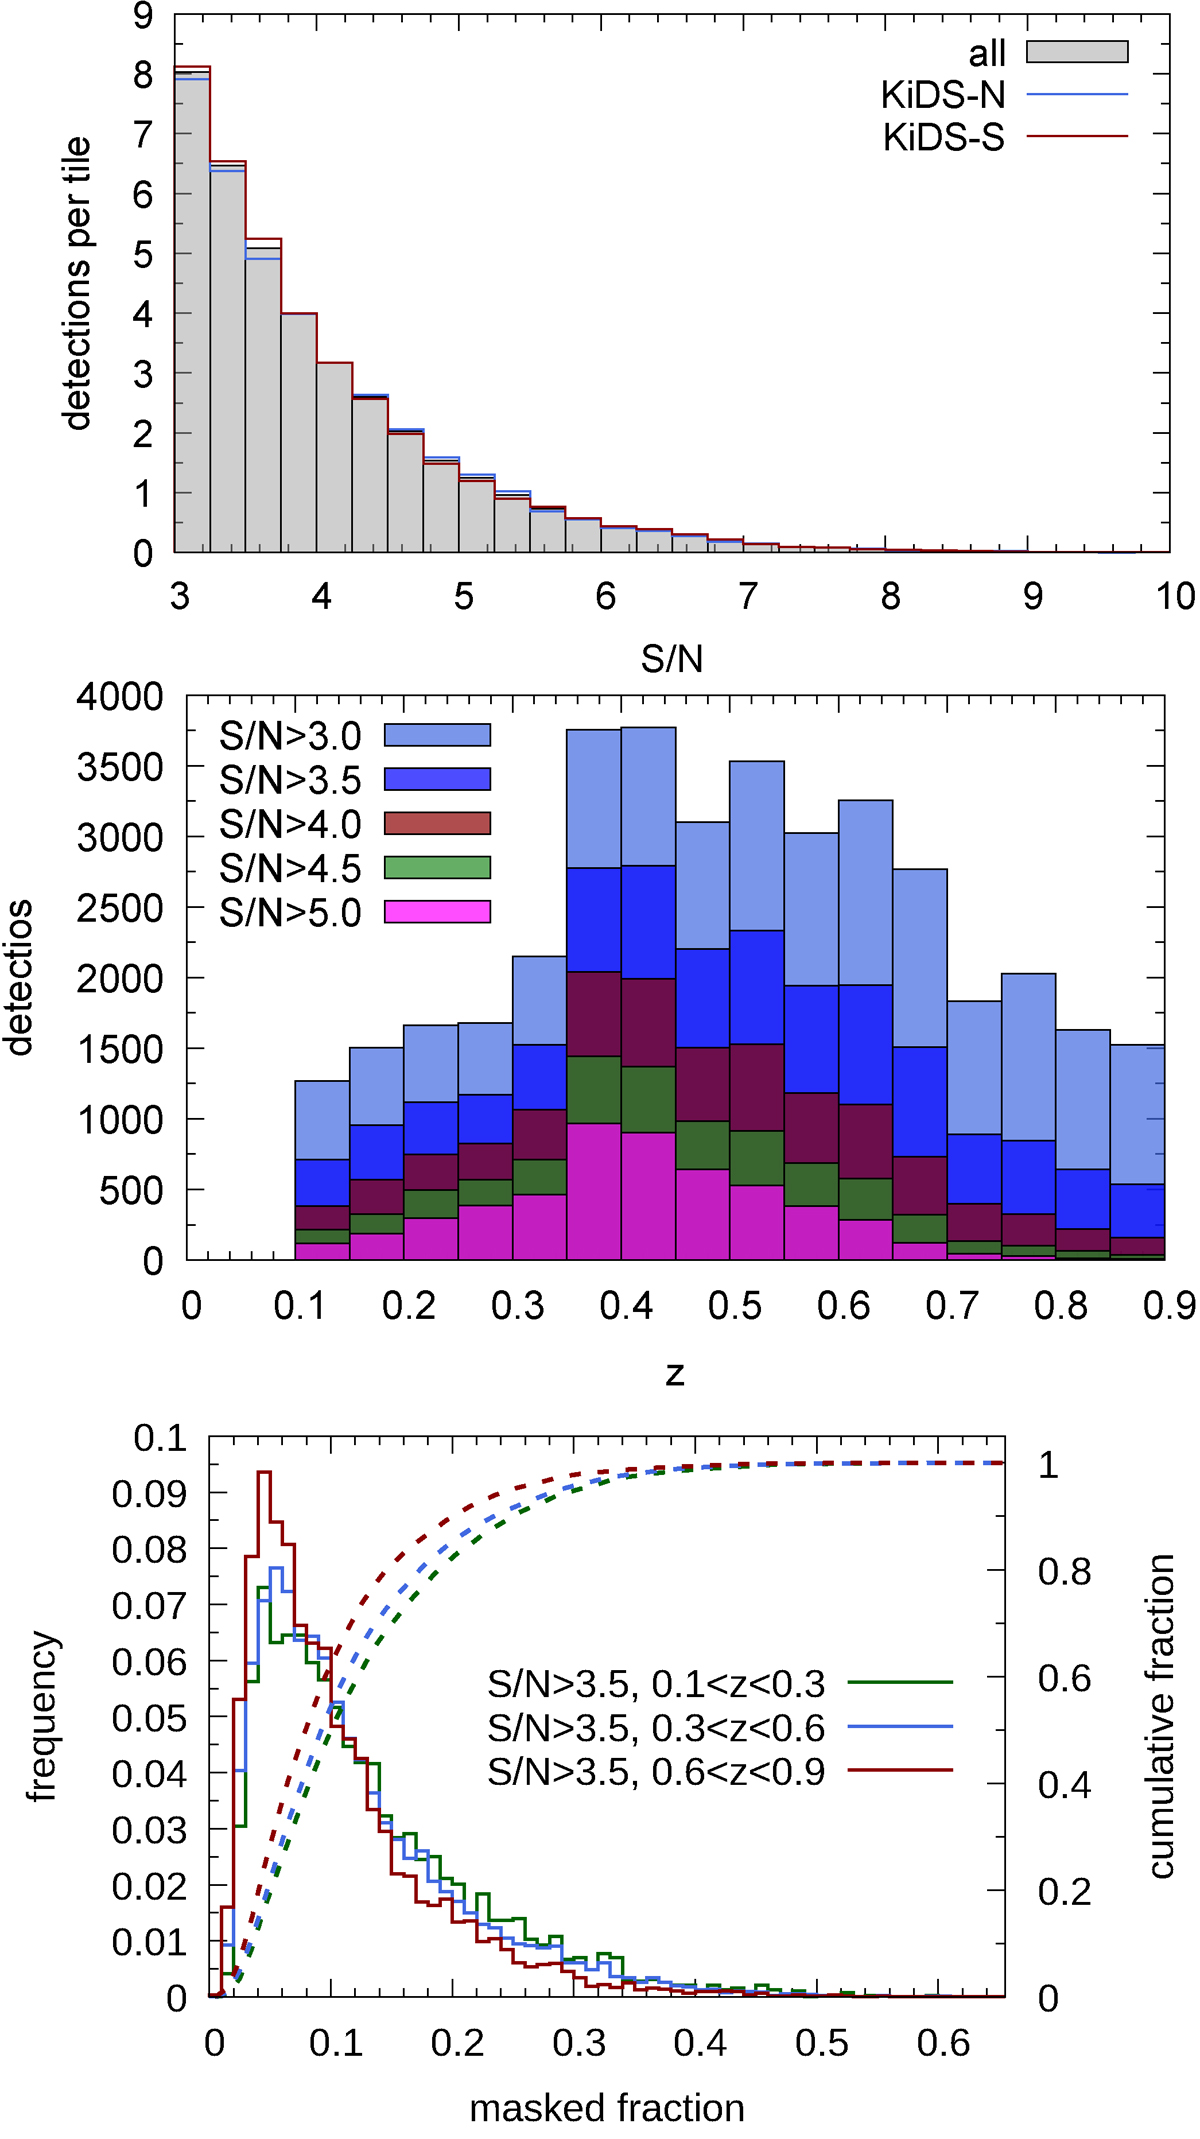
Download original image
Main properties of the cluster sample. Top panel: Average number of detections per survey tile as a function of the signal-to-noise ratio for the entire sample (gray histogram) and for the KiDS-N and KiDS-S stripes (blue and red lines, respectively). Central panel: Redshift distribution for five different S/N cutoffs. Bottom panel: Distribution of the masked fraction of detections in different redshift intervals.
Current usage metrics show cumulative count of Article Views (full-text article views including HTML views, PDF and ePub downloads, according to the available data) and Abstracts Views on Vision4Press platform.
Data correspond to usage on the plateform after 2015. The current usage metrics is available 48-96 hours after online publication and is updated daily on week days.
Initial download of the metrics may take a while.