Fig. 9.
Download original image
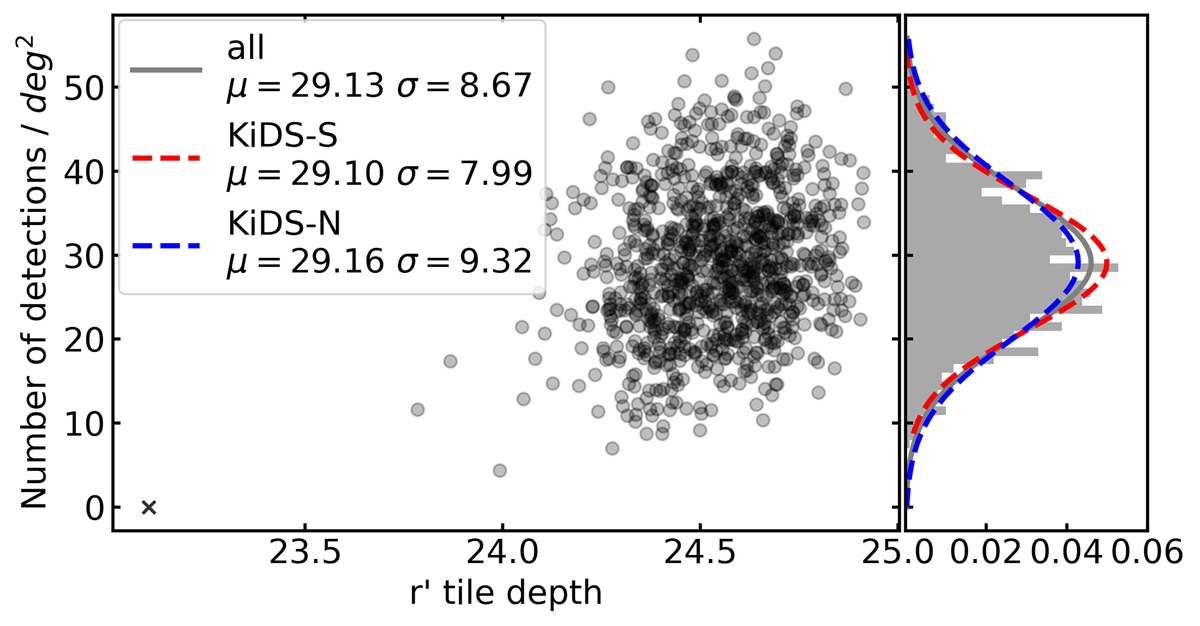
Left panel: Number density of detections with S/N > 3.5 as a function of the survey tile depth in the r-band. Each point represents an individual tile. Side panel: Probability distribution of the number of detections per tile for the entire sample (gray histogram) and for the KiDS-N and KiDS-S stripes (blue and red lines, respectively). The corresponding values of the mean μ and RMS σ are reported in the legend. The absence of any significant correlation and the Gaussian shape of the number density distributions indicate the homogeneity of the survey clusters detection efficiency when a strict cutoff of r < 24 is applied in the selection of the input galaxy sample. A few outliers are visible, corresponding to tiles with problematic photometry (see their list in Table 1). We excluded from the analysis the tile marked with an “x” (see bottom-left corner).
Current usage metrics show cumulative count of Article Views (full-text article views including HTML views, PDF and ePub downloads, according to the available data) and Abstracts Views on Vision4Press platform.
Data correspond to usage on the plateform after 2015. The current usage metrics is available 48-96 hours after online publication and is updated daily on week days.
Initial download of the metrics may take a while.