Fig. 12.
Download original image
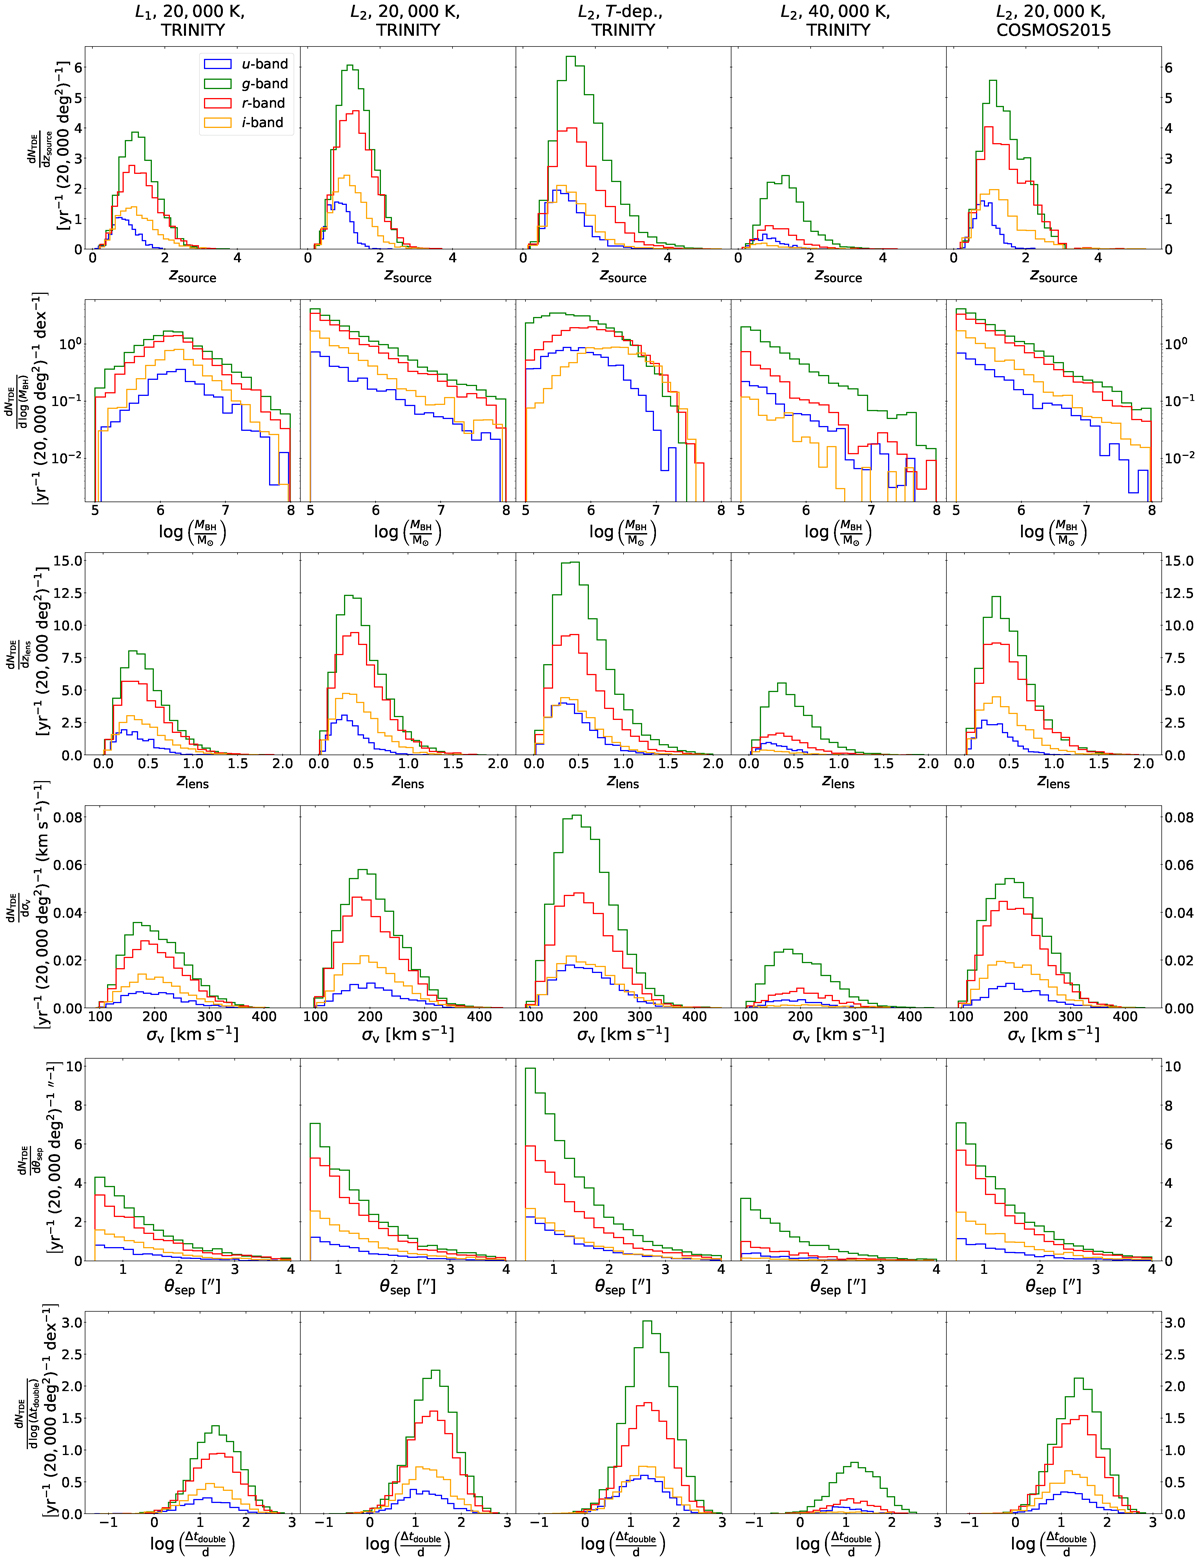
Differential rate of lensed TDEs for five representative models. The rows from top to bottom are the TDE redshifts, BH masses, lens redshifts, lens velocity dispersions, lensed image separations, and time delays of doubles. The three time delays for quads are shown in Appendix F. These figures were calculated for LSST magnitude limits.
Current usage metrics show cumulative count of Article Views (full-text article views including HTML views, PDF and ePub downloads, according to the available data) and Abstracts Views on Vision4Press platform.
Data correspond to usage on the plateform after 2015. The current usage metrics is available 48-96 hours after online publication and is updated daily on week days.
Initial download of the metrics may take a while.