Fig. 5.
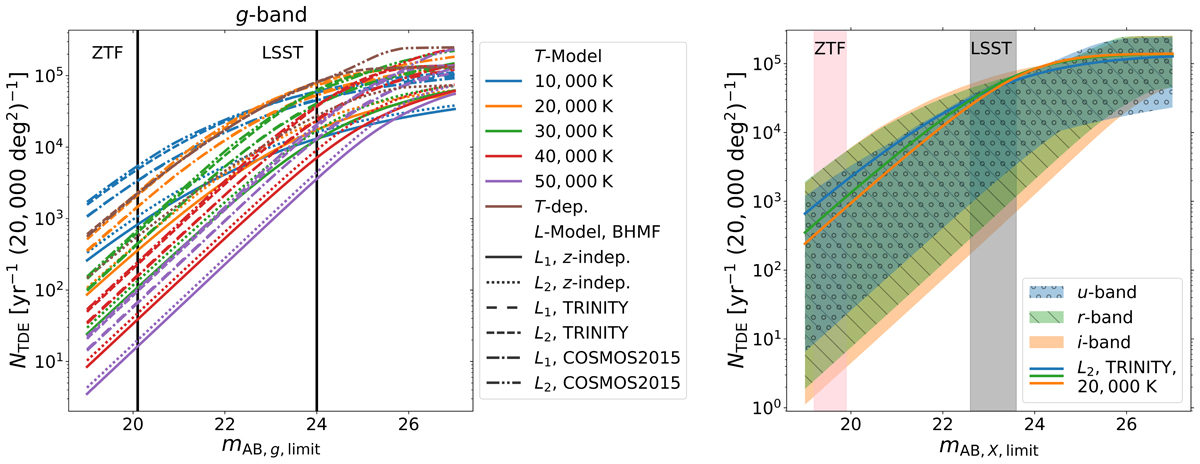
Download original image
Rate of TDEs as a function of survey limiting magnitude. The left panel shows the detection rate in the g band for the 33 models individually. We separated the color and line style information to keep the legend short. The right panel shows the detection rate in the u, r, and i bands, where each shaded region encompasses the spread in the models. We chose L2, TRINITY, 20 000 K as a fiducial model to guide the eye. The 33 models we considered for the unlensed TDE rate show a scattering factor of 𝒪(102) that can reach above 𝒪(103) for the u and i bands. The vertical black lines (left panel) and the colorful strips (right panel) show the observational magnitude limit for ZTF (g, r, i bands) and LSST (u, g, r, i bands).
Current usage metrics show cumulative count of Article Views (full-text article views including HTML views, PDF and ePub downloads, according to the available data) and Abstracts Views on Vision4Press platform.
Data correspond to usage on the plateform after 2015. The current usage metrics is available 48-96 hours after online publication and is updated daily on week days.
Initial download of the metrics may take a while.