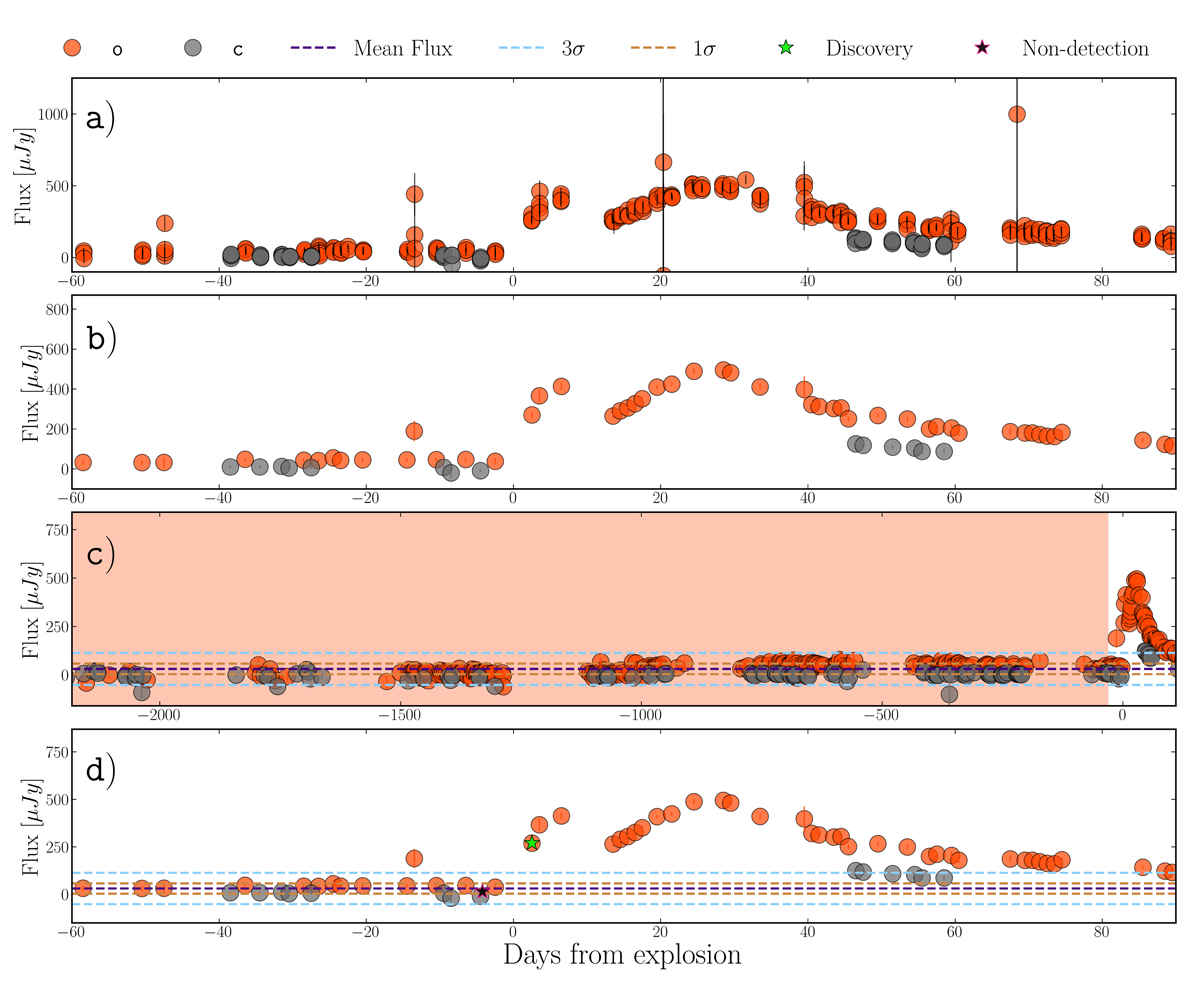
Fig. 1.
Download original image
Data cleaning and explosion epoch estimation example for SN 2021zby. The panels, labelled as a, b, c, and d from top to bottom, present different stages of the analysis (we detail a and b in Section 2 and c and d in Section 3). Red and grey dots represent photometry in the o and c bands, respectively. Panel (a) shows the raw ATLAS forced photometry. Panel (b) presents the photometry after applying the ATClean methodology detailed in Section 2. Panel (c) shows the pre-SN photometry, where the red region highlights the relevant data, and the sky blue and brown dashed lines represent the 3 and 1.5 σpre − SN values, respectively. In Panel (d), green and black star symbols represent the last non-detection and discovery, which we use to estimate the explosion time.
Current usage metrics show cumulative count of Article Views (full-text article views including HTML views, PDF and ePub downloads, according to the available data) and Abstracts Views on Vision4Press platform.
Data correspond to usage on the plateform after 2015. The current usage metrics is available 48-96 hours after online publication and is updated daily on week days.
Initial download of the metrics may take a while.