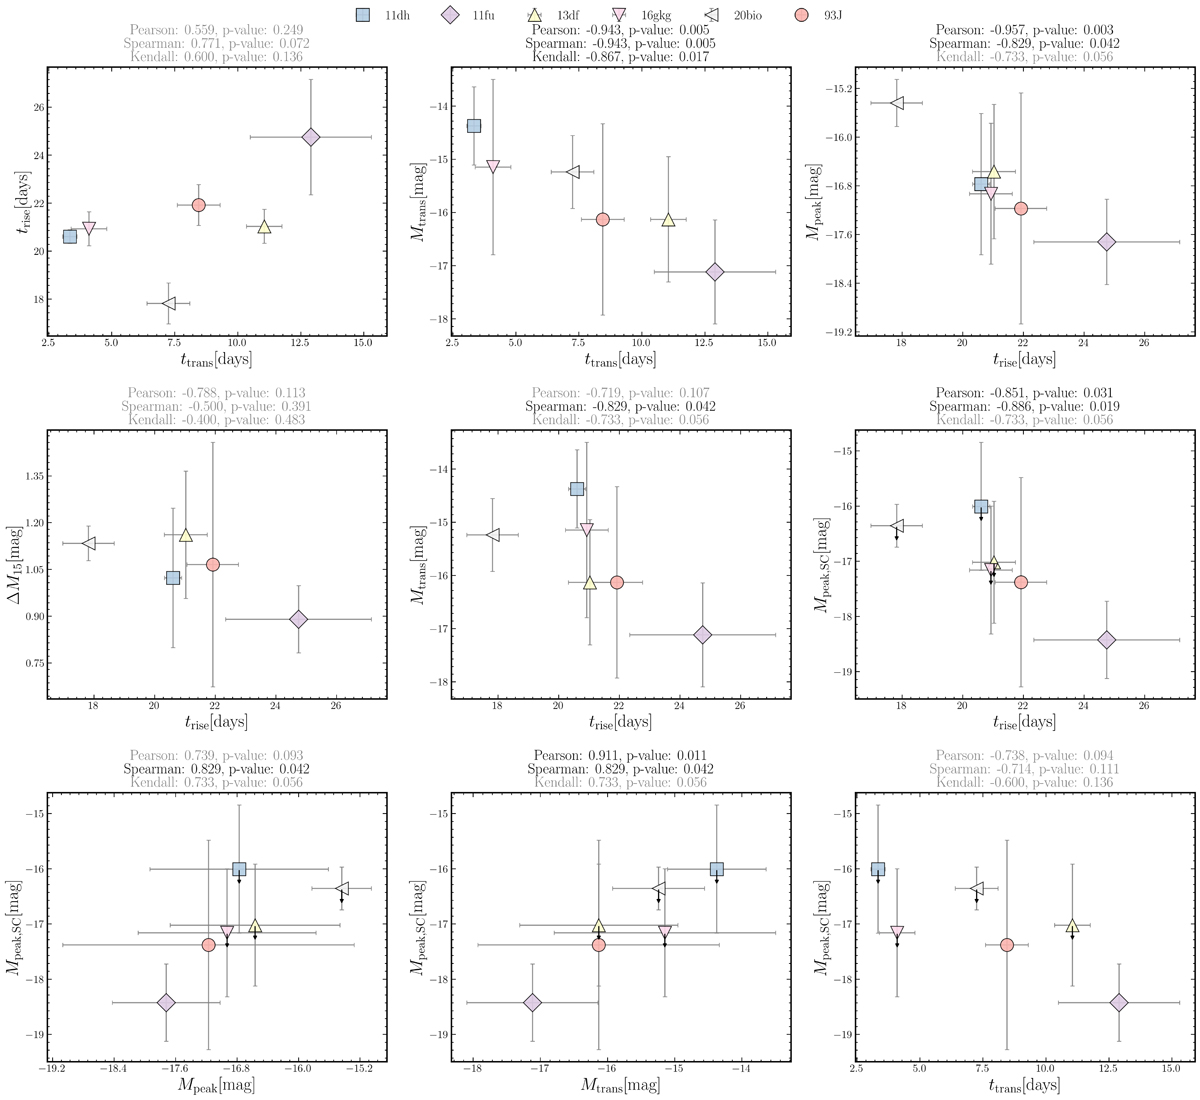
Fig. 11.
Download original image
Correlation analysis between parameters measured during the shock SC phase and those associated with the main peak of the light curve for the literature sample. Significant correlations are highlighted, including relationships within the SC phase, such as between the transitional absolute magnitude (Mtrans) and the SC rise time (trise), and between the SC peak absolute magnitude (Mpeak, SC) and Mtrans. Correlations within the main peak include Mpeak and trise. Additionally, correlations between the SC phase and the main peak are shown, including ttrans with trise, Mpeak, SC with trise, and Mpeak, SC with Mpeak. These relationships provide evidence linking the SC phase to the main peak properties, highlighting the continuity of physical processes across both phases. Non-significant correlations are also shown for completeness.
Current usage metrics show cumulative count of Article Views (full-text article views including HTML views, PDF and ePub downloads, according to the available data) and Abstracts Views on Vision4Press platform.
Data correspond to usage on the plateform after 2015. The current usage metrics is available 48-96 hours after online publication and is updated daily on week days.
Initial download of the metrics may take a while.