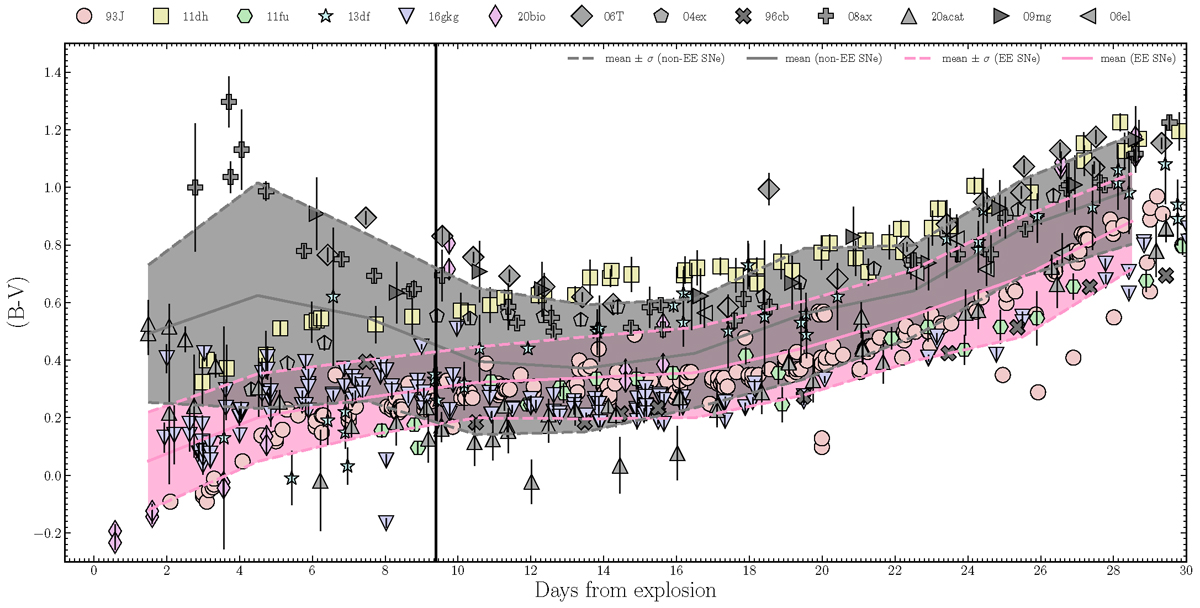
Fig. 12.
Download original image
B − V colour evolution for SNe with (seven) and without (five) SC up to 30 days post-explosion. Individual data points for SNe without SC are sation, while pastel-coloured markers represent those with SC. Solid lines show the centred moving averages, with pink representing SNe with SC and sation for those without SC. Dashed lines indicate the standard deviation (σ) around the mean for each time interval, and the filled regions represent the mean ± σ. The vertical black line marks the average upper limit for the SC duration. Analogous to Figure 9, this figure emphasizes the differences in colour evolution between the two groups, particularly in the early phases.
Current usage metrics show cumulative count of Article Views (full-text article views including HTML views, PDF and ePub downloads, according to the available data) and Abstracts Views on Vision4Press platform.
Data correspond to usage on the plateform after 2015. The current usage metrics is available 48-96 hours after online publication and is updated daily on week days.
Initial download of the metrics may take a while.