Fig. 13.
Download original image
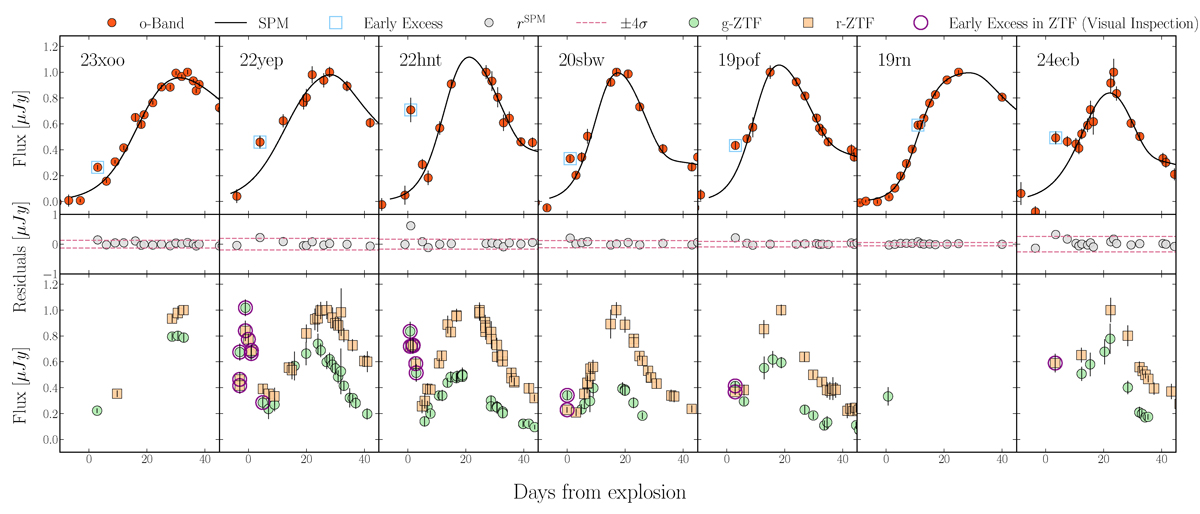
Zwicky Transient Facility verification of potential false positives with ZTF photometry. The top panels show the ATLAS o-band photometry, with potential SC points enclosed by blue open squares. The middle panels illustrate the residuals produced by the SPM model. The bottom panels display the ZTF g- and r-band photometry, with points consistent with an EE identified by visual inspection and enclosed in purple open circles.
Current usage metrics show cumulative count of Article Views (full-text article views including HTML views, PDF and ePub downloads, according to the available data) and Abstracts Views on Vision4Press platform.
Data correspond to usage on the plateform after 2015. The current usage metrics is available 48-96 hours after online publication and is updated daily on week days.
Initial download of the metrics may take a while.