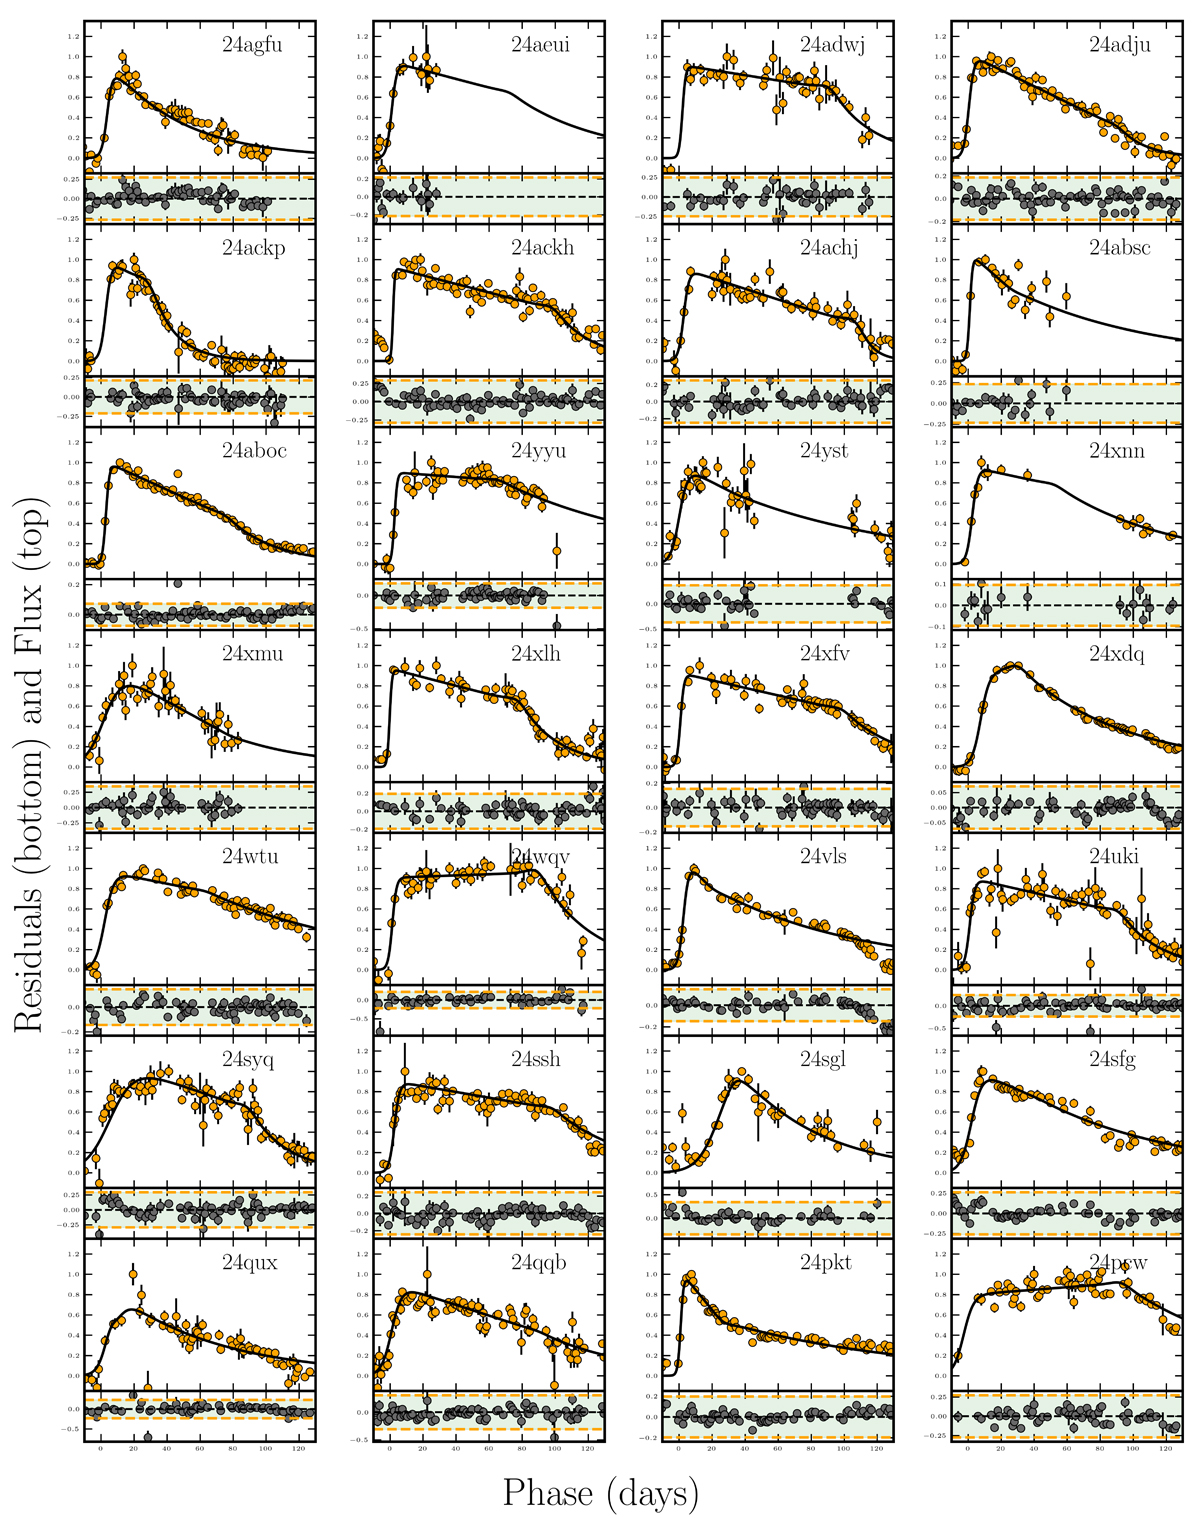
Fig. B.3.
Download original image
Supernovae parametric model fits and residuals for 27 SNe II. Orange circles show the ATLAS o-band photometry for each SN. Solid black lines represent the corresponding SPM fits. The name of each SN is indicated in the upper right corner of each light curve panel. Bottom panels display the residuals between the photometry and the SPM fits. The shaded green area marks the ±3σr region, and dashed orange lines indicate the ±3σr thresholds.
Current usage metrics show cumulative count of Article Views (full-text article views including HTML views, PDF and ePub downloads, according to the available data) and Abstracts Views on Vision4Press platform.
Data correspond to usage on the plateform after 2015. The current usage metrics is available 48-96 hours after online publication and is updated daily on week days.
Initial download of the metrics may take a while.