Fig. B.5.
Download original image
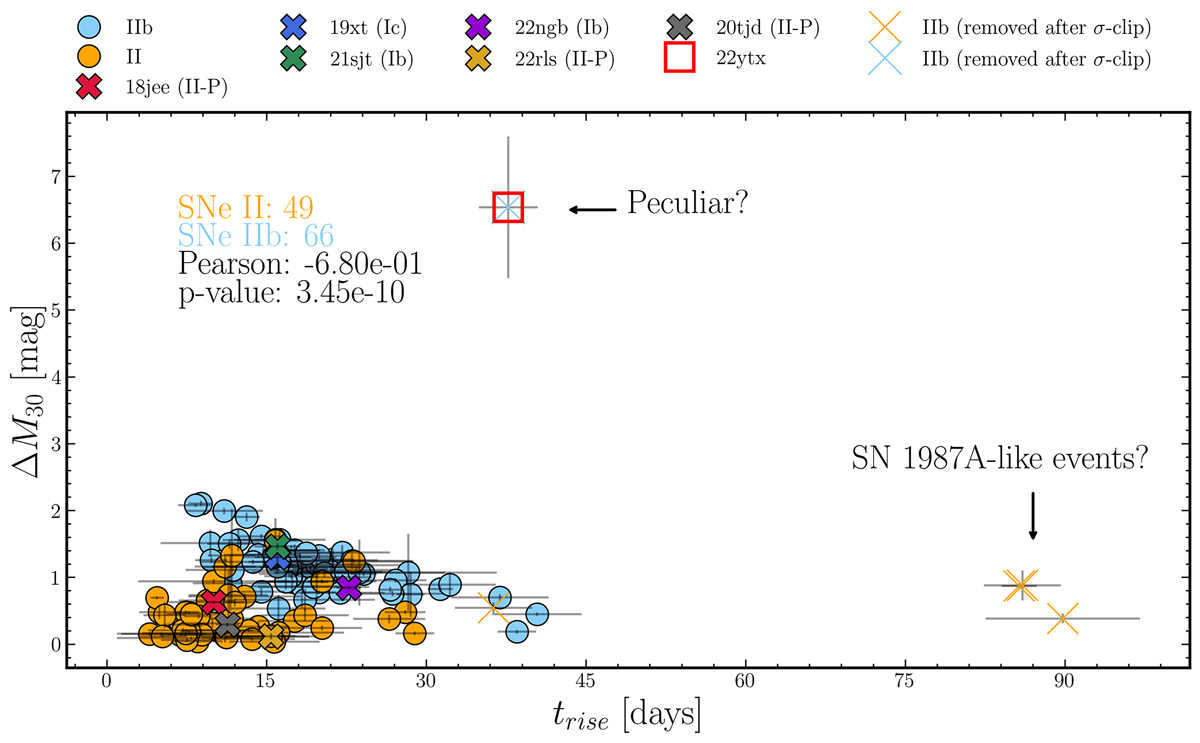
SNe IIb (blue dots) and SNe II (orange dots) in the trise–ΔM30 parameter space. Objects rejected through the spectroscopic reclassification method described in Section B.1 are marked with filled X symbols. Additionally, objects excluded after the σ-clipping procedure are shown with unfilled X markers. The number of SNe II and IIb in the sample is indicated, along with the correlation test result for SNe IIb.
Current usage metrics show cumulative count of Article Views (full-text article views including HTML views, PDF and ePub downloads, according to the available data) and Abstracts Views on Vision4Press platform.
Data correspond to usage on the plateform after 2015. The current usage metrics is available 48-96 hours after online publication and is updated daily on week days.
Initial download of the metrics may take a while.