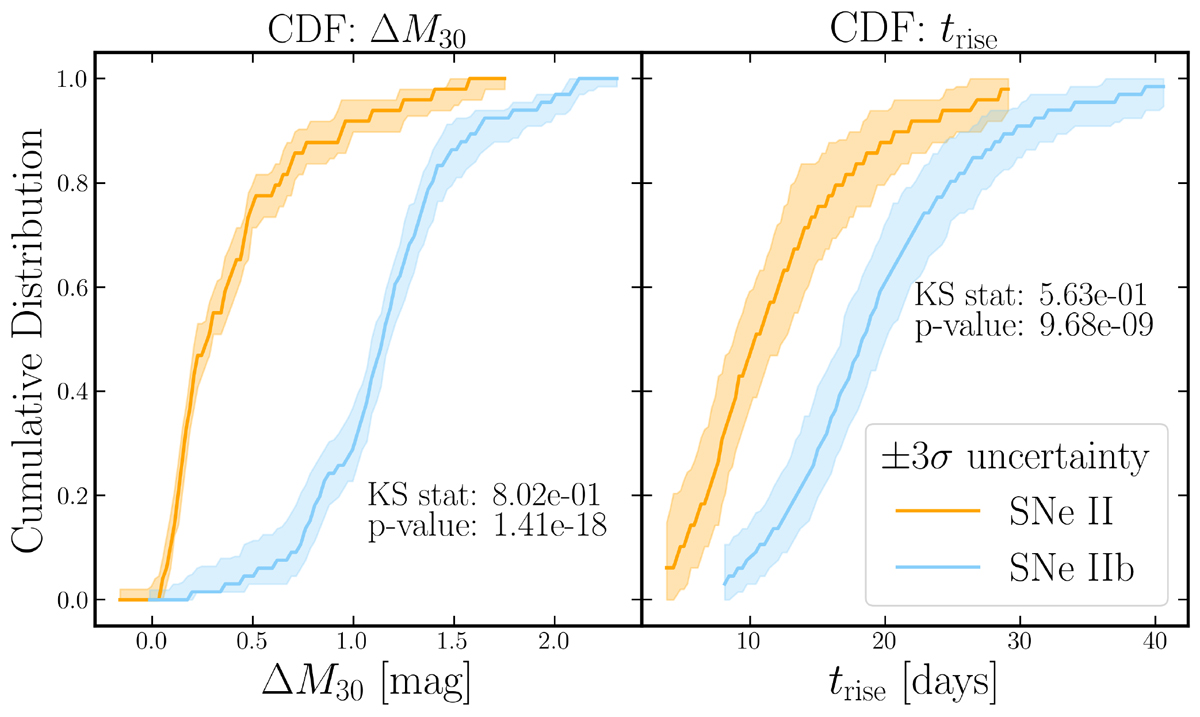
Fig. B.6.
Download original image
Cumulative distributions of ΔM30 and trise. The shaded regions represent the ±3σ confidence intervals estimated via Monte Carlo simulations. Five hundred realisations were generated for each distribution by perturbing the original measurements according to their associated uncertainties, assuming a Gaussian distribution. We computed the cumulative distribution function for each realisation and extracted the median, 0.3th percentile (lower bound), and 99.7th percentile (upper bound) to define the central trend and its corresponding error envelope.
Current usage metrics show cumulative count of Article Views (full-text article views including HTML views, PDF and ePub downloads, according to the available data) and Abstracts Views on Vision4Press platform.
Data correspond to usage on the plateform after 2015. The current usage metrics is available 48-96 hours after online publication and is updated daily on week days.
Initial download of the metrics may take a while.