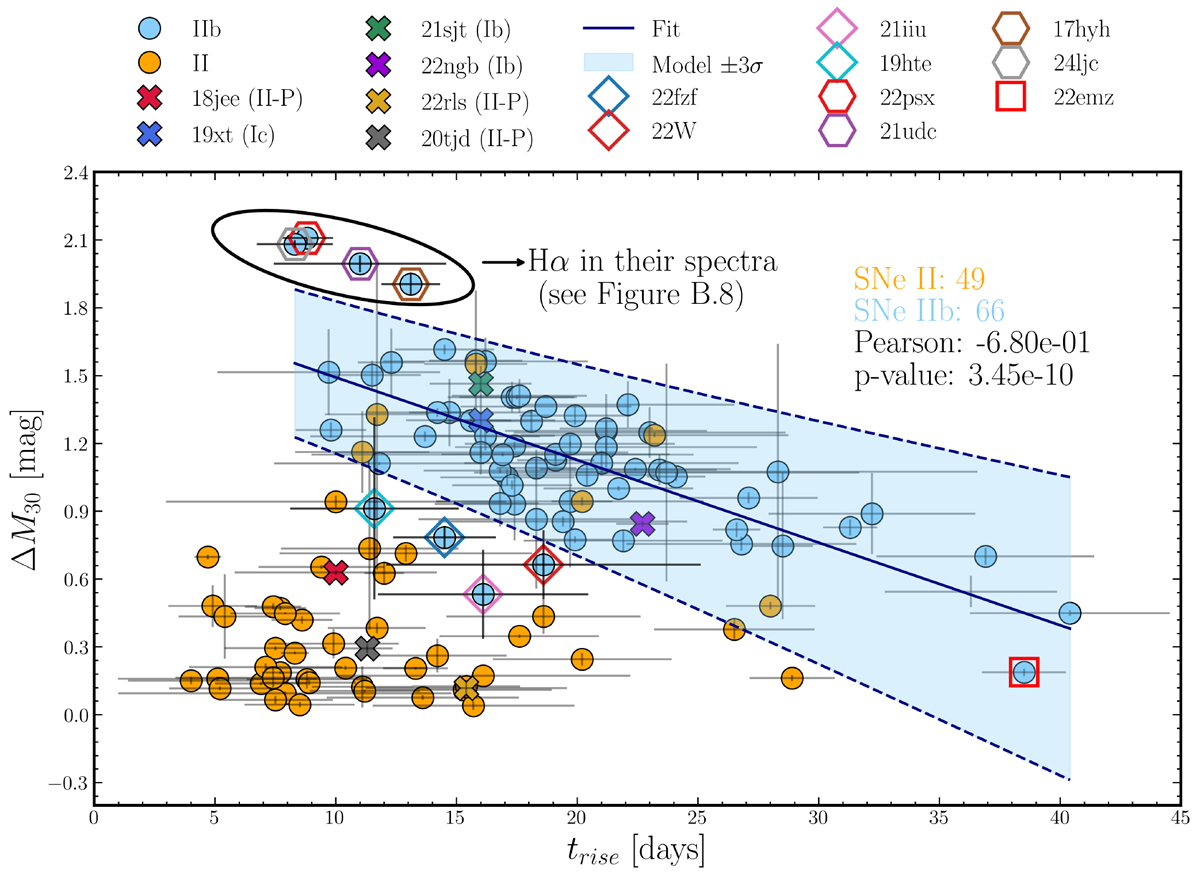
Fig. B.7.
Download original image
Same as Figure B.5, but zoomed in after removing the objects excluded by the σ-clipping. A linear fit and its ±3σ confidence region are shown as a solid and dashed blue line, respectively. Using this correlation, we identify objects above and below the confidence region, marked with diamonds and hexagons. The black ellipse encloses those above the confidence region that show Hα features in their spectra (see Figure B.8).
Current usage metrics show cumulative count of Article Views (full-text article views including HTML views, PDF and ePub downloads, according to the available data) and Abstracts Views on Vision4Press platform.
Data correspond to usage on the plateform after 2015. The current usage metrics is available 48-96 hours after online publication and is updated daily on week days.
Initial download of the metrics may take a while.