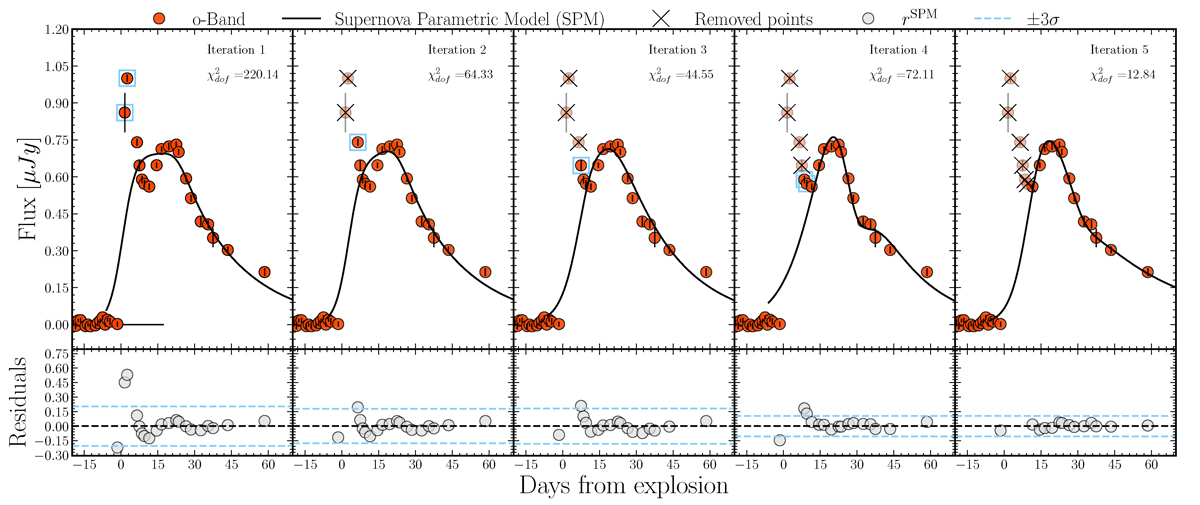
Fig. 3.
Download original image
Example of the SPM fit and refitting process for SN 2022jpx. The left panel shows the initial SPM fit, with outliers identified and enclosed by open blue squares in the top plot. The bottom plot displays the residuals associated with the SPM fit (rSPM), with dashed lines indicating the ±3σr thresholds used for outlier identification. From the left panel to the right, we illustrate the iterative SPM fitting process, where outliers are removed in each iteration until no outliers are detected. In this case, no outliers remain after the fifth iteration. The χd.o.f.2 value is reported in each panel for every iteration.
Current usage metrics show cumulative count of Article Views (full-text article views including HTML views, PDF and ePub downloads, according to the available data) and Abstracts Views on Vision4Press platform.
Data correspond to usage on the plateform after 2015. The current usage metrics is available 48-96 hours after online publication and is updated daily on week days.
Initial download of the metrics may take a while.