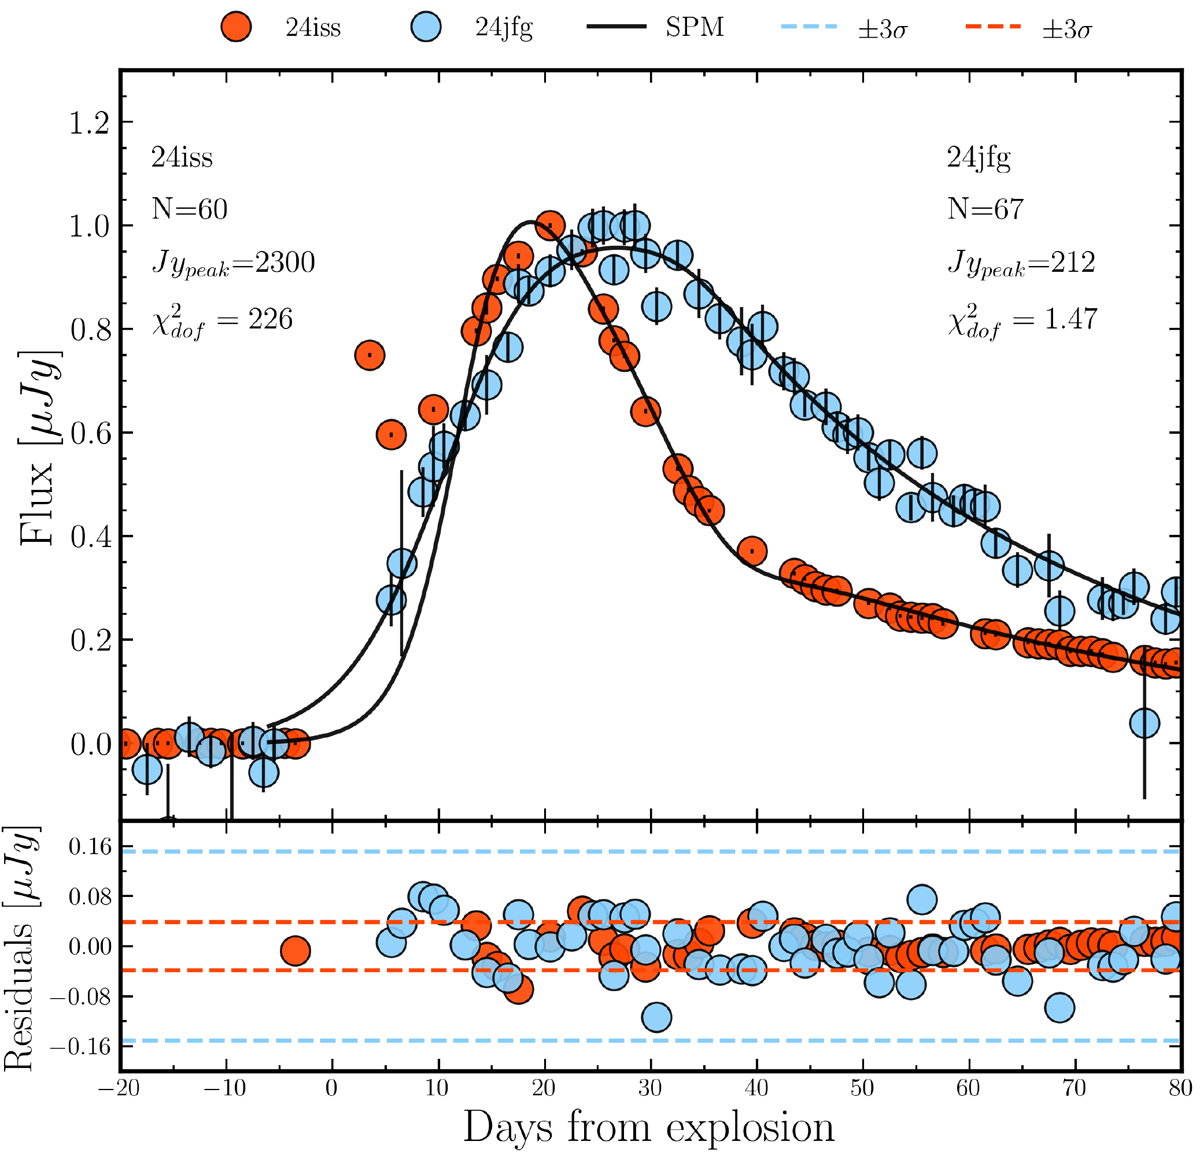
Fig. F.2.
Download original image
An illustrative example of χ2 overestimation for bright objects. The upper panel displays the light curves and SPM fits for SN 2024iss (red dots) and SN 2024jfg (blue dots), while the bottom panel shows their residuals. Within the upper panel, we report the number of observations, peak flux, and χdof2. The dashed lines in the bottom panel represent the values for three residual standard deviations. This example demonstrates how brighter objects with smaller residuals and lower relative errors can lead to an overestimation of χ2.
Current usage metrics show cumulative count of Article Views (full-text article views including HTML views, PDF and ePub downloads, according to the available data) and Abstracts Views on Vision4Press platform.
Data correspond to usage on the plateform after 2015. The current usage metrics is available 48-96 hours after online publication and is updated daily on week days.
Initial download of the metrics may take a while.