Fig. 4.
Download original image
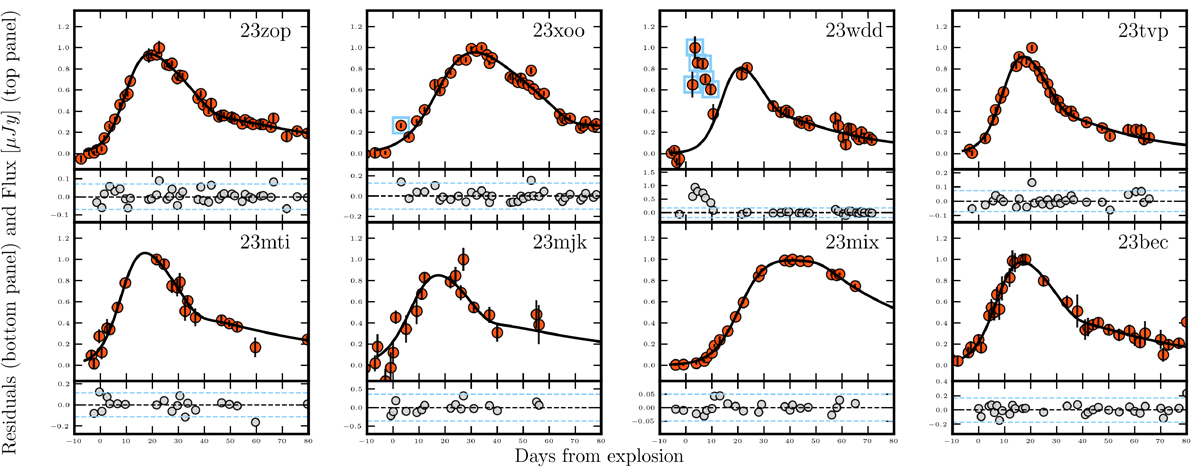
Supernovae parametric model fits and residuals for 8 representative SNe IIb. The red points show the o-band photometry from ATLAS for each of the SNe in our sample. The black continuous line represents each SPM fit. Inside each panel, we indicate the name of the corresponding SN. Bottom Panels display the residuals of the SPM fit for each SN. The dashed lines mark the ±3σr thresholds, which we use to identify outliers. We excluded these outliers from the SPM refitting process. Cyan squares highlight the outliers, which we define as evidence for EE.
Current usage metrics show cumulative count of Article Views (full-text article views including HTML views, PDF and ePub downloads, according to the available data) and Abstracts Views on Vision4Press platform.
Data correspond to usage on the plateform after 2015. The current usage metrics is available 48-96 hours after online publication and is updated daily on week days.
Initial download of the metrics may take a while.