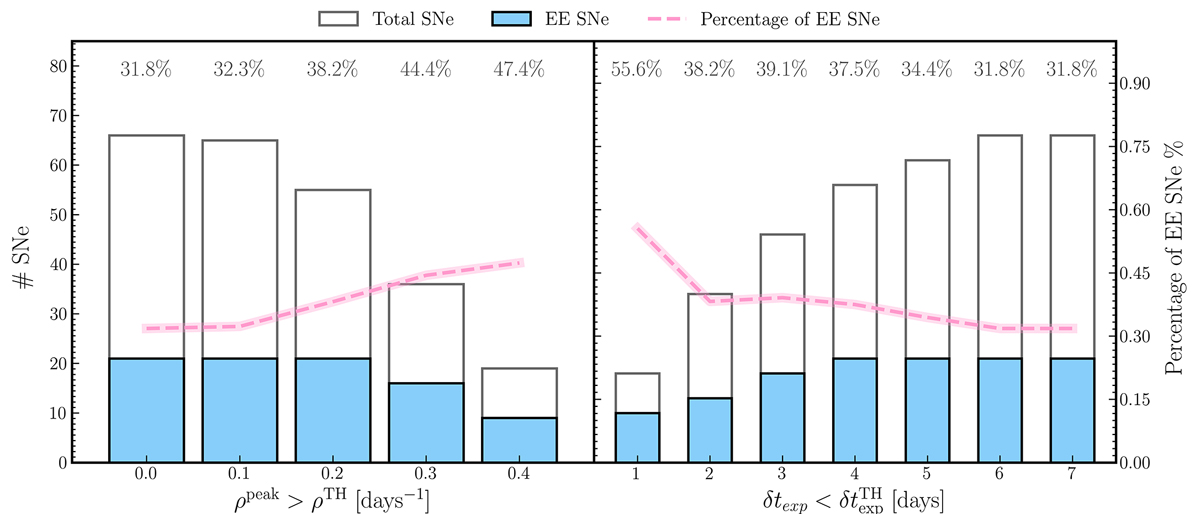
Fig. 6.
Download original image
Supernovae counts and EE percentages under specific criteria. The number of SNe IIb satisfying specific criteria for observational point density (ρpeak > ρTH, left panel) and explosion epoch error (δtexp < δtTH, right panel) are shown as unfilled bars. Blue-filled bars represent the subset EE SNe. The dashed pink line indicates the percentage of EE SNe for each criterion, with numerical percentages displayed above the bars.
Current usage metrics show cumulative count of Article Views (full-text article views including HTML views, PDF and ePub downloads, according to the available data) and Abstracts Views on Vision4Press platform.
Data correspond to usage on the plateform after 2015. The current usage metrics is available 48-96 hours after online publication and is updated daily on week days.
Initial download of the metrics may take a while.