Fig. 9.
Download original image
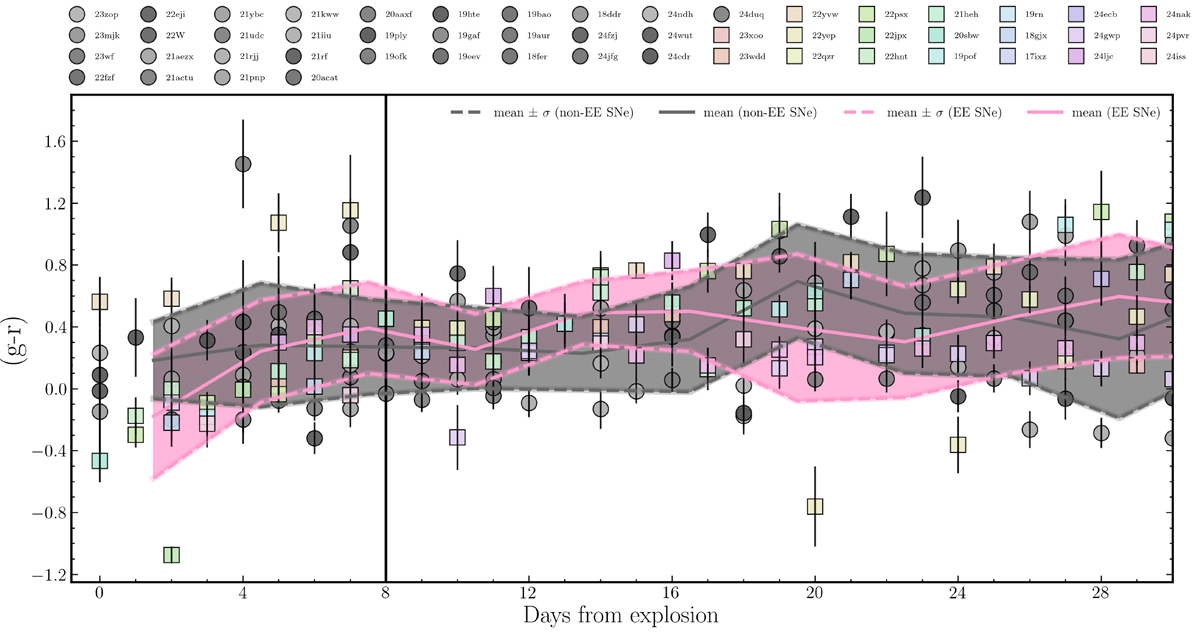
Evolution of the g − r colour for EE and non-EE SNe up to 30 days post-explosion. Individual measurements for non-EE SNe are shown as grey points, while pastel-coloured markers represent EE SNe. The solid lines correspond to the centred moving averages, pink for EE and sation for non-EE SNe. Dashed lines indicate the standard deviation (σ) per time bin, and the shaded regions denote the mean ± σ. The vertical black line marks the median upper limit of the EE duration (8 days).
Current usage metrics show cumulative count of Article Views (full-text article views including HTML views, PDF and ePub downloads, according to the available data) and Abstracts Views on Vision4Press platform.
Data correspond to usage on the plateform after 2015. The current usage metrics is available 48-96 hours after online publication and is updated daily on week days.
Initial download of the metrics may take a while.