Fig. 1.
Download original image
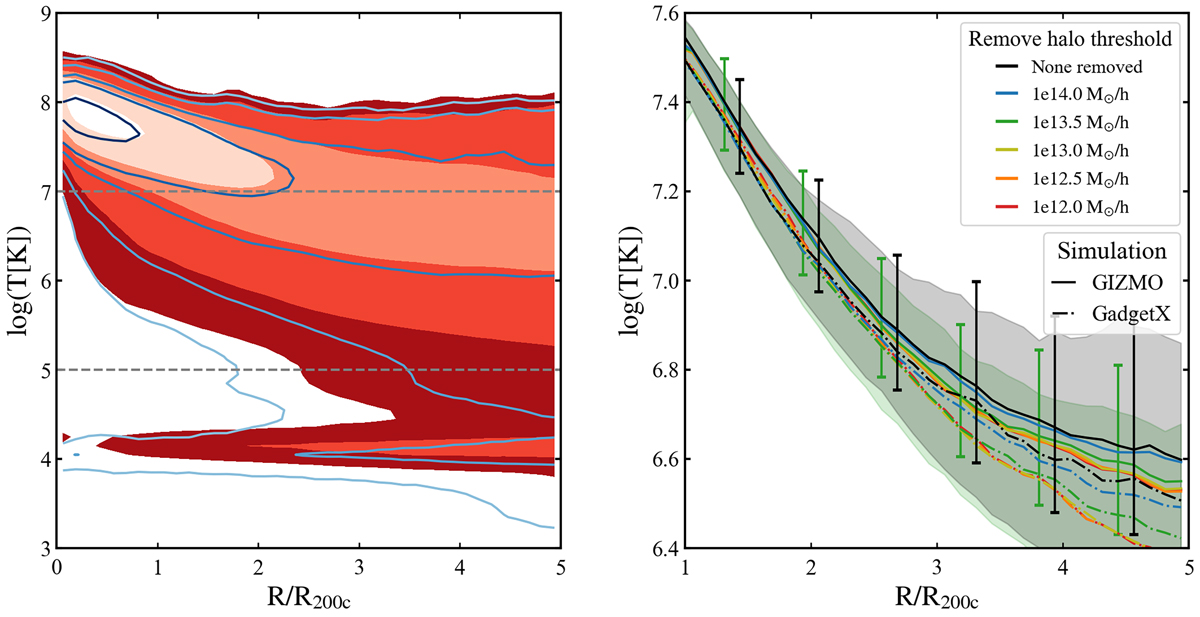
Temperature distribution of GIZMO-SIMBA (colour-filled contours) and GADGET-X (contour lines). The left panel shows the temperature distribution of all gas as a function of normalised radius from the cluster centres, while the right panel presents the corresponding temperature profiles. In the left panel, contour lines enclose 20%, 50%, 80%, 95%, and 99% of gas particles within the analysis region, with 2D radii normalised to R200c. Horizontal dashed lines indicate the warm-hot temperature range, defined between 105 K and 107 K. The right panel displays median temperature profiles of all 324 clusters with different line colours for different halo mass removal thresholds as indicated in the legend. The error bars for GIZMO and shadow regions for GadgetX show the 20–80 percentiles of all profiles. Only the results from all gas and the halo mass threshold of 1e13.5 M⊙/h are displayed here.
Current usage metrics show cumulative count of Article Views (full-text article views including HTML views, PDF and ePub downloads, according to the available data) and Abstracts Views on Vision4Press platform.
Data correspond to usage on the plateform after 2015. The current usage metrics is available 48-96 hours after online publication and is updated daily on week days.
Initial download of the metrics may take a while.