| Issue |
A&A
Volume 701, September 2025
|
|
|---|---|---|
| Article Number | A37 | |
| Number of page(s) | 10 | |
| Section | Cosmology (including clusters of galaxies) | |
| DOI | https://doi.org/10.1051/0004-6361/202554390 | |
| Published online | 02 September 2025 | |
THE THREE HUNDRED project: Gas properties outside of galaxy clusters with the WHIM contribution and detection
1
Key Laboratory for Research in Galaxies and Cosmology, Department of Astronomy, University of Science and Technology of China, Hefei, Anhui 230026, China
2
School of Astronomy and Space Science, University of Science and Technology of China, Hefei 230026, China
3
Departamento de Física Teórica, M-8, Universidad Autonoma de Madrid, Cantoblanco, 28049 Madrid, Spain
4
Centro de Investigación Avanzada en Física Fundamental (CIAFF), Facultad de Ciencias, Universidad Autónoma de Madrid, E-28049 Madrid, Spain
5
Institute for Astronomy, University of Edinburgh, Royal Observatory, Edinburgh EH9 3HJ, UK
6
Institute for Frontiers in Astronomy and Astrophysics, Beijing Normal University, Beijing 102206, China
7
Max Planck Institute for Extraterrestrial Physics Giessenbachstrasse 1, 85748 Garching, Germany
8
Department of Physics and Astronomy, University of the Western Cape, Robert Sobukwe Rd, Cape Town 7535, South Africa
9
School of Physics and Astronomy, University of Nottingham, Nottingham, NG7 2RD, UK
⋆ Corresponding author: This email address is being protected from spambots. You need JavaScript enabled to view it.
Received:
5
March
2025
Accepted:
1
July
2025
Abstract
We investigate the physical properties and detectability of warm-hot intergalactic medium (WHIM) gas with temperatures in the range 105 < T < 107 K around galaxy clusters using simulated galaxy clusters from THE THREE HUNDRED project. From our simulations with different input physics (GIZMO-SIMBA and GADGET-X), we consistently found that the median gas temperature, as a function of the radial distance from cluster centres, decreases to the WHIM upper bound, ∼107 K, at ∼2 × R200c. Meanwhile, the WHIM mass fraction increases with radius until ∼3 × R200c, where it plateaus slightly above 70% for both simulations at all investigated redshifts. By simulating X-ray emissions from all gas components, we found that the WHIM contribution at the soft X-ray band (0.2–2.3 keV) also increases with radius but eventually plateaus at larger distances. The differences between the two simulations become more pronounced at higher redshifts and larger radii, indicating that the WHIM observation can be used to constrain baryon models. After accounting for observational effects, primarily by removing (sub)halos, we predict that the signal-to-noise ratio of the X-ray signal obtained by stacking the eRASS1 galaxy cluster catalogue will be ∼6.4 for GIZMO-SIMBA and ∼20.8 for GADGET-X.
Key words: galaxies: clusters: general / X-rays: galaxies: clusters / X-rays: general
Talento-CM fellow.
© The Authors 2025
 Open Access article, published by EDP Sciences, under the terms of the Creative Commons Attribution License (https://creativecommons.org/licenses/by/4.0), which permits unrestricted use, distribution, and reproduction in any medium, provided the original work is properly cited.
This article is published in open access under the Subscribe to Open model. This email address is being protected from spambots. You need JavaScript enabled to view it. to support open access publication.
1. Introduction
Measurements of the cosmic microwave background indicate that baryons comprise approximately Ωb ∼ 0.049 of the cosmic mass-energy budget (Planck Collaboration I 2020). Estimates from the Lyman-α forest at z ∼ 2 − 3 support this value (Rauch 1998). However, summing all observed baryonic components across different wavelengths in the local Universe has revealed that ∼30 − 50% of these baryons remain undetected, leading to the so-called ‘missing baryon problem’ (e.g. Cen & Ostriker 1999; Bregman 2007; Shull et al. 2012, and references therein). This discrepancy may arise from incomplete accounting of all baryons. For instance, stellar mass is quantified through optical surveys, hot gas is detected via X-ray and thermal Sunyaev-Zel’dovich (tSZ) measurements (Sunyaev & Zeldovich 1972), and radio observations trace cold gas (e.g. Battye et al. 2004).
Cosmological hydrodynamical simulations have long suggested that the missing baryons reside in the warm-hot intergalactic medium (WHIM), a diffuse gas component outside galaxy halos with temperatures of T ∼ 105 − 107 K, which is extremely challenging to detect (see e.g. Davé et al. 2001; Martizzi et al. 2019; Holt et al. 2022; Li et al. 2022; Gouin et al. 2023). Additionally, the bulk of the WHIM is thought to reside within cosmic filaments, prompting focused observational efforts (e.g. Cui et al. 2019). We note that, in literature, more specified definitions of WHIM normally include gas density cuts; for example, Martizzi et al. (2019) requires the gas density nH < 10−4 cm−3 to be classified as WHIM. In this paper, though still under the name of WHIM, the density constraint is simply dropped because the focus region is outside of the clusters and halos and the warm dense gas becomes very little (Gouin et al. 2022). We have also verified that this density cut is generally in agreement with removing the halos in our simulations.
Detecting and quantifying the WHIM is difficult because it contains little observable atomic hydrogen in H1 absorption and is highly diffuse, leading to an extremely low surface brightness in emission. Furthermore, most absorption and emission features are expected in the soft X-ray band, where instrumental sensitivity is low and foreground contamination is significant.
Various methods have been employed to detect the WHIM. Using quasar absorption spectra from XMM-Newton, Nicastro et al. (2018) reported WHIM detection via O7 and O8 absorption in a few sight lines. However, this required significant telescope time and cannot be scaled up to obtain robust statistics until next-generation facilities such as NewAthena (Štofanová et al. 2024) become available. Meanwhile, O6 can be used to probe slightly cooler gas, T ∼ 105 K (e.g. Tepper-García et al. 2011; Oppenheimer et al. 2016; Bradley et al. 2022), and it is predominantly found outside virialised regions such as galaxies, groups, or clusters (e.g. Cen et al. 2001; Appleby et al. 2023). Thus, detections of O6 absorbers (e.g. Tripp et al. 2008; Pachat et al. 2016; Ahoranta et al. 2020, 2021; Holguin Luna et al. 2024) may also indicate the presence of WHIM gas. Stacking techniques (Kovács et al. 2019) have also been employed, but they make it difficult to constrain the physical conditions of the absorbers, thus limiting the confidence that can be placed in their association with the WHIM.
The WHIM can also be probed via its thermal SZ decrement. Simulations have suggested that most warm-hot gas resides in cosmic filaments (e.g. Cui et al. 2018a; Tuominen et al. 2021; Galárraga-Espinosa et al. 2021, 2022). Accordingly, de Graaff et al. (2019) stacked Planck tSZ Compton y-parameter maps for over one million galaxy pairs to detect the WHIM in intergalactic filaments, obtaining a mass fraction of ∼11%. Similar results have been found using slightly different methods and datasets (Tanimura et al. 2019, 2020; Isopi et al. 2024). Ferraro et al. (2016) explored the use of kinetic SZ signals as an unbiased tracer of the large-scale electron distribution. However, since the SZ signal strength depends on gaspressure, which declines rapidly outside halos (albeit not as steeply as X-ray emission), detecting individual WHIM systems remains challenging until next-generation SZ facilities come online.
Another approach involves stacking soft X-ray emission from putative WHIM gas, but this too is difficult due to the diffuse nature and moderate ionisation of WHIM (Ursino et al. 2011; Parimbelli et al. 2023). Recently, Tanimura et al. (2022) detected the stacked X-ray emissions of 463 filaments at the significance of 3.8σ, and Zhang et al. (2024a) reported a 5.4σ detection of the WHIM in filaments using the eROSITA observation. Zhao et al. (2025) selected four inter-cluster filaments as candidates, and demonstrated that with 200 ks exposure for each candidate, the gas properties could be determined by the Hot Universe Baryon Surveyor (Cui et al. 2020).
The presence of WHIM gas is also expected in the outskirts of galaxy clusters, where the gas density and temperature naturally fall within the WHIM range as they decrease with radius (see, e.g. Li et al. 2023). Using constrained realisations to generate 2D X-ray maps and profiles of a mock Coma cluster, Li et al. (2022) predicted that the emission line distributions were consistent with cluster observations (Mirakhor & Walker 2020), supporting the presence of WHIM gas in cluster outskirts. Bonamente et al. (2022) analysed ROSAT data of the Coma cluster, identifying an excess of soft X-ray radiation consistent with WHIM gas. eROSITA has also detected gas near the Coma cluster and surrounding filaments (Churazov et al. 2021, 2023; Reiprich et al. 2021), while McCall et al. (2024) used eROSITA to trace gas in the Virgo cluster out to 3R200. However, these detections typically reach a maximum statistical significance of only ∼3σ. Moreover, contamination from bright sources and background fluctuations complicates the analysis of low-redshift systems, making stacking necessary for studying cluster outskirts at higher redshifts.
Zhang et al. (2024b) analysed hot circumgalactic medium (CGM) profiles of low-mass halos out to Rvir, finding a lower-than-expected hot CGM fraction within Rvir, which reapproaches the ΛCDM prediction near 3Rvir. In one of the most comprehensive recent studies, Lyskova et al. (2023) stacked 38 galaxy clusters at 0.05 < z < 0.2 with masses 2 × 10¹⁴ M⊙ < M500c < 9 × 10¹⁴ M⊙, obtaining X-ray profiles extending to 3R500c ∼ 1.9R200c. They evaluated density, temperature, and entropy profiles, and estimated a baryon fraction of Ωb/Ωm ≈ 0.15 outside R500c. These results suggest that X-ray stacking around clusters may currently be the most viable approach for detecting WHIM emission with existing instruments.
Therefore, we employed THE THREE HUNDRED simulations (Cui et al. 2018b), which contain 324 clusters, to develop methods for detecting WHIM using current instruments via stacking. Since most simulation models calibrate parameters against observed data from within clusters, their accuracy in diffuse regions remains uncertain. Therefore, we compare results from two different galaxy formation models, GIZMO-SIMBA and GADGET-X, in the cluster outskirts.
The structure of this paper is as follows: In Section 2 we describe our simulation data, halo catalogue, and X-ray modelling. The density and temperature properties of the clusters are analysed in Section 3. Section 4 presents mock observations using a stacking technique to study the X-ray evolution of warm-hot gas beyond clusters. In particular, Section 4.3 details our methodology for estimating signal-to-noise ratios from observational data. Finally, we discuss our findings and conclusions in Section 5.
2. Data and method
We introduce THE THREE HUNDRED simulations in Section 2.1 and describe the halo catalogue constructed using Amiga’s Halo Finder (AHF; Knollmann & Knebe (2009)) in Section 2.2. The X-ray emission from simulated gas was computed using our C++ program, which interpolates tables from AtomDB (Foster & Heuer 2020). The code is designed for computational efficiency while maintaining accuracy within computational constraints. Our methodology is detailed in Section 2.3.
2.1. The Three Hundred project
THE THREE HUNDRED project selects 324 distinct regions centred on the most massive clusters from the dark-matter-only MultiDark Planck 2 simulation (MDPL2; Klypin et al. (2016)). MDPL2 consists of 38403 dark matter particles within a (1 h−1 Gpc)3 volume and adopts the Planck 2015 cosmology (Planck Collaboration XIII 2016). We re-simulated these clusters subsequently using several full-physics hydrodynamical models from modified initial conditions at z = 120. We introduced the gas particles in a central high-resolution region and reduced the particle resolution beyond 15 h−1 Mpc. The high-resolution particles have masses of Mdm = 1.27 × 10⁹h−1 M⊙ for dark matter and Mgas = 2.36 × 10⁸h−1 M⊙ for gas.
In this work, we use simulation results from GADGET-X (Rasia et al. 2015; Beck et al. 2016), a modified version of GADGET3 (an updated version of GADGET2; Springel 2005), and GIZMO-SIMBA (Davé et al. 2019; Cui et al. 2022). Further details on the simulations can be found in e.g. Cui et al. (2018b, 2022).
2.2. Halo catalogue and sample selection
Halos in the simulation are identified using Amiga’s Halo Finder (AHF; Knollmann & Knebe 2009) with an overdensity threshold of 200ρcrit. The halo mass, M200c, is defined as the total mass inside R200c. The selected cluster samples from MDPL2 remain centred in high-resolution regions at z = 0 by construction and are thus re-matched with the central halos. At redshift zero, the central halos are defined as the most massive ones within a search radius of approximately R200c from the centre of the high-resolution region. At higher redshifts, the central halos are traced through the merger tree to identify their main progenitors.
For observational comparisons, we generated 2D maps and profiles. In each simulation, we conducted analysis within a circular region centred on the central halo. This cylindrical volume has a radius of 5R200c from the halo centre and a half-thickness of 5R200c. Since THE THREE HUNDRED simulations are zoom-in simulations, we only used the selected high-resolution regions in this work in order to exclude low-resolution particles.
2.3. X-ray map generation and stacking procedure
The X-ray surface brightness was computed using a C++ program. The program is an updated version of the one used in our previous work (Li et al. 2022). The simulation region was divided into small pixels with a solid angle ΔΩ, and the surface brightness was calculated as:
 (1)
(1)
where E1 and E2 define the X-ray photon energy range. The emissivity, Λ, was obtained from look-up tables provided by AtomDB (Foster & Heuer 2020, version 3.0.9).1 The variables nH, i, Ne, i, Ti, and Zi represent the number density of hydrogen ions, the number of free electrons, the gas temperature, and the metallicity of the gas element, i. The terms zi and DL(zi) denote the cosmological redshift and luminosity distance of the gas element. We adopted the 0.2 ∼ 2.3 keV energy band to maximise the signal from warm-hot gas while matching eROSITA’s sensitivity range. The code has been optimised for large-scale simulations where spectral resolution is not required, enabling efficient computation of X-ray maps for thousands of clusters within hours. Key optimisations include precomputing spectral interpolation and performing band integration during preprocessing rather than at runtime, significantly improving computational efficiency. However, observational effects and systematics are not yet included.
Each cluster was used only once with parallel viewing for the generation of mock X-ray maps. For the stacking of X-ray maps, every cluster was also counted only once by simply aligning all images without any scaling or rotation. All the images are generated following the same procedure and normalised to R200c and we believe the 324 clusters are large enough for the statistics. To isolate the contributions from the warm-hot gas, halos in the projected X-ray images were removed. To achieve this, we simply excised all 2D pixels within the AHF-identified halo radii of R200c, which introduces holes in single-cluster maps. During stacking, these empty pixels were excluded when computing surface brightness but zero-filled when computing fluxes. Radial profiles were computed using the average values of cluster measurements to ensure robustness (however, the median of individual cluster measurements was used for temperature). Since we focus primarily on the outskirts of clusters and excluded halos in these clean X-ray mock images, the density cut for selecting the WHIM, which has been applied in the literature(e.g. Martizzi et al. 2019), was not taken into account. Further, we note that in this simple stacking process, we ignored many observational effects besides the background and contamination, such as centre offset (e.g. Cui et al. 2016), beam size, and uncertainties on the true R200c.
3. Physical properties of gas in the vicinity of central clusters
3.1. Temperature and density
As shown in Equation (1), temperature and density are key parameters in X-ray calculations. Temperature affects the gas ionisation state, the spectral distribution of emitted photons, and the WHIM mass fraction. The left panel of Figure 1 presents the temperature distributions as a function of 2D radius for GIZMO-SIMBA (colour-filled contours) and GADGET-X (contours).
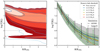 |
Fig. 1. Temperature distribution of GIZMO-SIMBA (colour-filled contours) and GADGET-X (contour lines). The left panel shows the temperature distribution of all gas as a function of normalised radius from the cluster centres, while the right panel presents the corresponding temperature profiles. In the left panel, contour lines enclose 20%, 50%, 80%, 95%, and 99% of gas particles within the analysis region, with 2D radii normalised to R200c. Horizontal dashed lines indicate the warm-hot temperature range, defined between 105 K and 107 K. The right panel displays median temperature profiles of all 324 clusters with different line colours for different halo mass removal thresholds as indicated in the legend. The error bars for GIZMO and shadow regions for GadgetX show the 20–80 percentiles of all profiles. Only the results from all gas and the halo mass threshold of 1e13.5 M⊙/h are displayed here. |
For this analysis, each simulation was divided into radial and logarithmic temperature bins, and we count gas mass in each bin. The results were then stacked across all 324 clusters, with all halos retained in the left panel but removed as indicated in the right panel of Figure 1. Contours represent cumulative gas particle fractions at levels of 20%, 50%, 80%, 95%, and 99%.
The median gas temperature decreases from ∼108 K at the cluster centre to ∼4 × 10⁶ K at 5R200c. Within 2.5R200c, GADGET-X and GIZMO-SIMBA show only minor temperature differences. However, at larger radii GIZMO-SIMBA forms slightly hotter gas compared to GADGET-X.
The right panel of Figure 1 presents the temperature profiles of GIZMO-SIMBA and GADGET-X as a function of 2D cluster-centric distance. Mass-weighted temperature profiles were computed before taking the median across all clusters. Data for R < R200c have been excluded (see Li et al. 2023, 2020) for details on intra-cluster gas properties).
The various profiles in the figure illustrate how the gas properties change when halos above different mass thresholds are removed. However, differences between these threshold variants remain minimal out to R ∼ 2.5R200c. Diffuse gas in GADGET-X appears slightly cooler than in GIZMO-SIMBA, consistent with the contours shown in the left panel. In both simulations, gas transitions into the WHIM phase beyond ∼2.2R200c and maintains WHIM-level temperatures (T > 105 K) out to 5R200c. These results confirm that most gas remains in the WHIM phase even at large radii, with the contribution from halo gas, across a range of mass thresholds, having only a minor impact on the median temperature.
Gas density, which primarily determines the strength of X-ray emission, is shown as a function of radius in the left panel of Figure 2. Following the methodology of Figure 1, we analysed the gas particles in the radial shells and stacked the results. The mean density is defined as
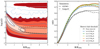 |
Fig. 2. Left panel: Similar to Figure 1, but for the density distribution of all the gas particles for GIZMO-SIMBA (colour-filled contours) and GADGET-X (contours). The contour lines enclose 20%, 50%, 80%, 95%, and 99% of gas particles within the analysis region, with 2D radii normalised to R200c. The two black contours indicate the region on this plane that encloses 50% of the WHIM gas in each simulation. Right panel: Radial profile of the fraction of gas that is WHIM. Coloured lines show different halo mass removal thresholds as indicated in the legend. |
 (2)
(2)
High-density gas beyond R200c, which is typically associated with T ∼ 104 K gas, is mostly found in galaxies or other virialised structures. This gas is denser and slightly hotter in GIZMO-SIMBA compared to GADGET-X, where it does not exhibit a clear separation from lower-density gas. Overall, the gas density declines steeply within 2R200c and then flattens.
At R ≳ 2R200c, GADGET-X contains a higher fraction of dense gas than GIZMO-SIMBA, as indicated by the offsets in the 80%, 95%, and 99% contours. This may result in stronger X-ray signals in GADGET-X compared to GIZMO-SIMBA. Regarding WHIM, this gas in GADGET-X also appears slightly denser than in GIZMO-SIMBA, as highlighted by the two black contour lines in the left panel of Figure 2.
The right panel of Figure 2 shows the WHIM mass fraction as a function of radius, with the y-axis representing the ratio of WHIM gas to total gas mass. This fraction is computed in 2D radial bins across all 324 clusters before stacking. Black lines include all gas, while coloured lines exclude particles within halos above certain mass thresholds. The clear separation between the black and coloured lines, around ∼10% at R ≳ 3R200c, is due to the decrease in total gas mass compared to WHIM mass, as WHIM gas is largely absent inside massive halos (Figure 1). Removing halo gas increases the WHIM fraction by ∼10%, suggesting that the X-ray signal is more strongly influenced by warm gas than hotter gas components.
Declining temperatures (Figure 1, right panel) correlate with increasing WHIM fractions up to approximately 3R200c (Figure 2), beyond which WHIM gas comprises ∼70% of the total mass. The GADGET-X model exhibits a slightly higher WHIM fraction than GIZMO-SIMBA within 2.5R200c, but this trend reverses at larger radii. This difference may arise from differences in feedback models. For instance, the jet-driven feedback in GIZMO-SIMBA can expel gas to larger radii, reaching distances as far as 4Rvir, as noted by Yang et al. (2024). This is broadly consistent with the higher gas temperatures observed in GIZMO-SIMBA (Figure 1, left panel). Both simulations show maximum WHIM fractions when removing halos below 1013.5 M⊙/h, indicating that WHIM gas constitutes a significant fraction of the total gas mass in lower-mass halos.
3.2. The redshift evolution of gas properties in galaxy cluster outskirts
As structure forms, the gas temperature systematically increases within 2.5R200c, as shown in Figure 3. This is primarily driven by halo virialisation, which appears to have a consistent effect beyond R200c. Beyond 2.5R200c, GIZMO-SIMBA exhibits higher temperatures at z = 0.5 than at z = 0, a trend also observed in GADGET-X beyond 3R200c. This difference is partly influenced by the radial normalisation. The temperature discrepancies between GIZMO-SIMBA and GADGET-X become more pronounced at higher redshifts. For example, at z = 1, gas temperatures beyond 2R200c in GIZMO-SIMBA are about 50% higher than those in GADGET-X. These temperature differences may be attributed to the strong AGN jet feedback in GIZMO-SIMBA, which is typically active around z ∼ 2 (Sorini et al. 2022).
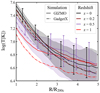 |
Fig. 3. Similar to the right panel of Figure 1, but showing temperature profiles at different redshifts with all halos included. Line styles indicate the simulation type, while colours represent different redshifts. All the profiles show the median temperature of all 324 clusters. In general, gas outside the clusters is cooler in GADGET-X than in GIZMO-SIMBA, particularly at large radii. The 20% and 80% percentiles are shown with error bars for GIZMO and shaded regions for GadgetX. Again, these error bars are shown only for z = 0 and z = 0.5 results. |
Similarly, WHIM gas density profiles at z = 0, 0.2, 0.5, and 1 are shown in Figure 4. The top panel indicates higher gas densities at higher redshifts, which is consistent with cosmic expansion. The WHIM gas density is systematically higher in GADGET-X than in GIZMO-SIMBA, with the difference decreasing at larger radii. This may be due to the fact that no halos have been removed in these profiles. As shown in Figure 2, GADGET-X exhibits a higher WHIM contribution from low-mass halos compared to GIZMO-SIMBA.
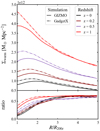 |
Fig. 4. Radial surface density profiles of warm gas (top) and the fraction of warm gas relative to all gas (bottom). Line styles indicate the simulation type, while colours represent different redshifts. We note that no halos have been removed. |
The bottom panel of Figure 4 reveals that WHIM fractions increase with redshift within ∼2R200c. This redshift evolution is primarily driven by the steady increase in the gas temperature, as shown in Figure 3. The inflection point is at about R ≳ 2.5R200c, and goes slightly farther because of the increase of the mass of the clusters. This trend is also shown in Gouin et al. (2022), which has a 3D result with the samples of smaller halos and clusters. Beyond this point, the WHIM fraction remains remarkably stable, indicating a co-evolution of WHIM and the total gas component that is largely unchanged across redshifts at the outside area. This stability suggests that stacking cluster outskirts at different redshifts is a reliable approach for studying the WHIM.
4. X-ray results
While simulations have indicated significant WHIM contributions in cluster outskirts, observational detection remains challenging and requires stacking techniques to improve the signal-to-noise ratio (Veronica et al. 2024; Popesso et al. 2024). In this section, we assess the feasibility of detecting WHIM gas beyond galaxy clusters using X-ray observations.
4.1. X-ray map stacking and WHIM detection in the vicinity of galaxy clusters
We computed 0.2 ∼ 2.3 keV X-ray surface brightness maps to facilitate WHIM detection. The maps are centred on the halo centre and stacked. The top panels of Figure 5 show WHIM-only X-ray maps. In this case, the signal comes only from the WHIM gas. We note that halos more massive than 1013.5 M⊙ have been excluded for the top panels as described in Section 2.3. The middle panels display the total X-ray emission, i.e. from all gas particles, with the same halos excluded. The bottom panels present the total X-ray emission from all gas without removing any halo.
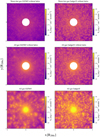 |
Fig. 5. Stacked 0.2 ∼ 2.3 keV X-ray surface brightness maps for GIZMO-SIMBA (left) and GADGET-X (right). The top panels display X-ray emission from only WHIM gas with halos more massive than 1013.5 M⊙/h removed. The middle panels show X-ray emission from all gas particles with the same halos, M200c > 1013.5 M⊙/h, removed. The bottom panels present X-ray emission also from all gas particles, but without removing halos. |
Due to the nature of the massive clusters that form our sample, effectively only Coma-like objects are stacked in this analysis. The full region spans 10 × R200c. It is evident that GADGET-X produces more compact, bright sources, whereas GIZMO-SIMBA exhibits smoother distributions, likely due to stronger feedback mechanisms driving gas particles to larger radii (e.g. Yang et al. 2024; Luo et al. 2024). The similarity between the middle and top panels beyond the cluster cores confirms that halo removal effectively isolates WHIM-dominated X-ray emission.
Figure 6 quantifies the radial trends in X-ray emission. After masking pixels containing massive halos, we stacked maps following the methodology in Figure 5. The average pixel values were then computed in radial bins. Typically, X-ray emission around massive clusters is visually detectable out to ∼R200c or down to a surface brightness of 10−15 erg s−1 cm−2 arcmin−2, and the signal is primarily contributed by hot gas (e.g. Mirakhor & Walker 2020). Beyond R200c, the emission drops below the detection limit of current X-ray telescopes. Notably, differences between the models result in distinct profiles: the X-ray emission in GIZMO-SIMBA is significantly lower than in GADGET-X. This discrepancy arises from the density differences shown in Figure 2, where GADGET-X maintains higher gas densities in the cluster outskirts, likely due to contributions from low-mass halos, as seen in Figure 5. We did not exclude halos with even lower masses, as current X-ray telescopes struggle to detect them beyond the local Universe.
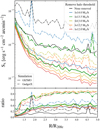 |
Fig. 6. X-ray surface brightness profile of the total gas obtained via the stacking method (top) and the fractional contribution of the X-ray signal from warm-hot gas (bottom). Line styles represent different simulations, while colours indicate halo removal thresholds. Thickened lines correspond to the removal of halos above 1013.5 M⊙/h. |
The bottom panel of Figure 6 shows the fractional contribution of the X-ray signal from WHIM gas. The X-ray contribution of WHIM in GADGET-X is much higher than that in GIZMO-SIMBA. This is because the local density of the warm-hot gas particles in GADGET-X is higher than that in GIZMO-SIMBA. And density has a quadratic effect on the surface brightness. Both simulations exhibit an increase in WHIM contribution when halos above 1013.5 M⊙/h are removed. As expected, excluding lower-mass halos further reduces the total flux while keeping the WHIM fraction stable. This indicates that a 1013.5 M⊙/h threshold effectively preserves the signal while isolating the WHIM emission. Thus, 1013.5 M⊙/h appears to be the optimal threshold for detecting WHIM features.
4.2. The X-ray signal at higher redshift
Increasing the redshift correlates with decreasing cluster masses and greater distances. Figure 7 presents the X-ray profiles at different redshifts. Similarly to Figure 6, the top panel displays the X-ray surface brightness profiles, while the bottom panel shows the WHIM contribution fractions. Observational data are overplotted: green plus symbols (+) represent the Coma cluster surface brightness profile in the 0.4–2.0 keV band from Churazov et al. (2021), and the blue Xs indicate the stacked X-ray profile of clusters at redshifts 0.05–0.2 in the 0.3–2.4 keV band from Lyskova et al. (2023).
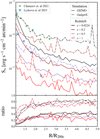 |
Fig. 7. op panel: Stacked X-ray surface brightness profiles of total gas for GIZMO-SIMBA and GADGET-X at various redshifts. Bottom panel: WHIM contribution ratios. Halos above 1013.5 M⊙/h have been removed. Green plus symbols (+) represent the Coma cluster surface brightness profile in the 0.4–2 keV band from Churazov et al. (2021). The blue Xs indicate the stacked X-ray profile of clusters at redshifts 0.05–0.2 in the 0.3–2.3 keV band from Lyskova et al. (2023). |
The analysis assumes an energy conversion factor (ECF) of 1012 cm2 erg−1 and converts radii using R200c = 1.6R500c. Data from these papers have been normalised as per the eROSITA telescope module and were therefore multiplied by 7 to eliminate the effect of normalisation and account for the full array. We found the following:
-
At all redshifts, the GADGET-X model produces a stronger X-ray emission signal than the GIZMO-SIMBA model, even at z = 1, where GIZMO-SIMBA exhibits significantly higher gas temperatures than GADGET-X. While the GADGET-X result at z ∼ 0.02 aligns well with the Coma profile from Churazov et al. (2021), the GIZMO-SIMBA profile at z ∼ 0.2 closely matches the stacked result from Lyskova et al. (2023), except at R ∼ 2.25 × R200c. However, we note that our results do not account for any telescope systematics beyond the coarse conversion from R500c to R200c.
-
As expected, the X-ray emission decreases significantly with redshift in both simulations, necessitating a large number of clusters for reliable detection at high redshift.
-
The WHIM contribution remains largely independent of redshift (bottom panel), despite a factor of two difference between GADGET-X and GIZMO-SIMBA. This consistency simplifies the interpretation of the WHIM fraction derived from the X-ray emission.
-
Radial profiles flatten beyond 2 × R200c, which is consistent with Figure 4. Therefore, we analysed the X-ray flux between 2R200c and 3R200c, a range that approximately corresponds to the splashback radius and the shock radius (Lebeau et al. 2024; Zhang et al. 2025), for WHIM signal characterisation in Section 4.3.
4.3. Detectability
For observational feasibility, it is crucial to determine the number of clusters that must be stacked to achieve a desired X-ray signal-to-noise ratio2. Using data from the first eROSITA All-Sky Survey (eRASS1; Merloni et al. 2024) and the eROSITA Final Equatorial-Depth Survey (eFEDS; Brunner et al. 2022; Liu et al. 2022), we estimate the background level of eROSITA surveys to be BG = 0.0059 counts s−1 arcmin−2. Assuming an exposure time of t = 100 s and using simulated cluster angular sizes, we computed the theoretical 5σ detection threshold, as shown in Figure 8. By comparing the mean simulated X-ray fluxes, the required number of clusters to achieve 5σ significance is determined by solving the equation
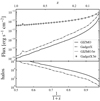 |
Fig. 8. Average flux between 2R200c and 3R200c outside central clusters as a function of redshift, along with their 5σ significance thresholds (top panel). The result was obtained by removing all halos above 1013.5 M⊙/h. The bottom panel shows the required number of clusters to achieve a 5σ detection as a function of expansion factor, a. The corresponding redshift is indicated along the top. These results are based on eROSITA observational systematics and assume an exposure time of 100s. |
 (3)
(3)
where
 (4)
(4)
and
 (5)
(5)
Here, F is the average flux in erg s−1 cm−2; ECF is the energy conversion factor, taken as 1.074 × 1012 cm2 erg−1 for the 0.2 ∼ 2.3 keV band (Brunner et al. 2022); and Ac is the solid angle of the statistical area.
As shown in Figure 8, the average flux from both models decreases significantly with redshift, dropping from approximately 3(8)×10−12 erg s−1 cm−2 for GIZMO-SIMBA (GADGET-X) to around 10−16 erg s−1 cm−2. Consequently, the number of clusters required to achieve a 5σ detection is expected to increase exponentially. Since GIZMO-SIMBA produces a lower X-ray flux due to its lower gas density, it is unsurprising that a larger number of clusters must be stacked to reach 5σ significance.
Using the expectations from Figure 8, we predicted the achievable signal-to-noise ratio (SNR) based on the eRASS1 galaxy cluster catalogue (Bulbul et al. 2024). Our sample selection criteria included clusters with 0.1 < z < 0.5, Lext > 6, and Pcont < 0.3. Cluster masses were converted using the approximation M200c ∼ 3M500c, and only clusters with M200c > 1014.5 M⊙ were retained to match our simulated cluster sizes. Signal and noise values were interpolated from the simulated results based on cluster redshifts, and exposure times are taken directly from the catalogue. After applying these criteria, 3802 clusters remained for stacking. We estimate an SNR of ∼6.444 for the GIZMO-SIMBA model and ∼20.81 for the GADGET-X model. These values would approximately double if eRASS-4 data is used, providing an even more optimised detection of the WHIM.
5. Conclusions
Using THE THREE HUNDRED simulations, we have investigated detection methods for missing baryons, primarily in the form of WHIM, in cluster outskirts. By applying a stacking methodology, we generated averaged X-ray surface brightness maps and profiles and estimated the required sample sizes for WHIM detection with eRASS1. We analysed the GIZMO-SIMBA and GADGET-X models to assess the differences between the simulation models and to ensure the robustness of our results. The main findings are summarised as follows:
-
Warm-hot gas serves as the primary reservoir of the missing baryons due to its intermediate temperatures (105 ∼ 107 K) and low densities. It becomes the dominant component beyond 2R200c in cluster outskirts. The GIZMO-SIMBA and GADGET-X models predict similar WHIM fractions, but GADGET-X exhibits higher gas densities, whereas GIZMO-SIMBA tends to have higher temperatures in the cluster outskirts. This radius is related more to the cluster mass, than the 2D or 3D statistical method or simulation models.
-
At lower redshifts, the density of warm-hot gas decreases due to cosmic expansion. The fraction of warm-hot gas is also lower, as structure formation heats the gas within ∼2 × R200c. Beyond this radius, however, the WHIM mass fraction remains relatively constant.
-
The warm-hot gas fraction becomes the highest between 2R200c and 3R200c. In this region, X-ray fluxes for GADGET-X clusters range from 2 × 10⁻¹⁶ erg s−1 cm−2 at z = 1 to 10−11 erg s−1 cm−2 at z = 0.0224. GIZMO-SIMBA fluxes are approximately 50% lower than those of GADGET-X.
-
Using the eRASS1 cluster catalogue and data, we predict a SNR of ∼6.444 for the GIZMO-SIMBA model and a SNR of ∼20.81 for the GADGET-X model.
It is clear that GADGET-X gives quite different results on the WHIM contributions compared to GIZMO-SIMBA. Undoubtedly, this difference is rooted in the baryon models. The significant differences are presented in Cui et al. (2022) (see Table 2): different gas cooling models, metal cooling table (Wiersma et al. 2009) versus Grackle (Smith et al. 2017); Stellar feedback, kinetic feedback (Springel & Hernquist 2003) versus two-phase winds with a galaxy mass, M*, dependent loading factor (Davé et al. 2016; Anglés-Alcázar et al. 2017); and the BH and AGN models, Bondi accretion with mechanical and radiative modes feedback (Rasia et al. 2015) versus Torque-limited and Bondi accretion with kinetic and X-ray feedback (Davé et al. 2019). Each difference can affect the gas distributions at different times and scales. Therefore, it is difficult to disentangle the contributions of these models to the WHIM fractions. However, as shown in Li et al. (2023), the gas in GIZMO-SIMBA tends to have a higher temperature at a high redshift compared to GADGET-X (Fig. 1) within halos, which indicates an earlier stellar feedback in GIZMO-SIMBA. At a low redshift, there is less hot gas within halos but more diffused gas in GIZMO-SIMBA, which can be caused by its very energetic AGN feedback, with the jet outflow velocity of 15 000 km/s. This is in agreement with the results in Figure 1, Figure 2, and Yang et al. (2024). We anticipate that the strong AGN feedback reduces the gas density (also increases the gas temperature) outside of halos and leads to a lower WHIM contribution. Nevertheless, this difference indicates a very strong constraint on the baryon models when using the WHIM contribution from X-ray measurements.
Finally, we note that our X-ray emission calculations are theoretical and do not account for observational corrections such as instrument response. These factors are closely tied to specific observational setups, and we leave their incorporation to future work focused on detecting warm-hot gas using targeted observational surveys.
We note that this SNR is for the total X-ray signal because it is almost impossible to separate out the X-ray signal coming only from WHIM gas.
Acknowledgments
We thank Elena Rasia, Sara Santoni, Yunliang Zheng and Xiaoyuan Zhang for useful discussions. We also thank the anonymous referee for valuable comments and suggestions. This work is supported by the National Natural Science Foundation of China Nos. 12192224. RJL is supported by the China Scholarship Council. WC is supported by Atracción de Talento Contract no. 2020-T1/TIC19882 granted by the Comunidad de Madrid and by the Consolidación Investigadora grant no. CNS2024-154838 granted by the Agencia Estatal de Investigación (AEI) in Spain. He also thanks the Ministerio de Ciencia e Innovación (Spain) for financial support under Project grant PID2021-122603NB-C21, ERC: HORIZON-TMA-MSCA-SE for supporting the LACEGAL-III Latin American Chinese European Galaxy Formation Network) project with grant number 101086388, and the science research grants from the China Manned Space Project, CMS-CSST-2025-A04. HYW acknowledgements supports from CAS Project for Young Scientists in Basic Research, Grant No. YSBR-062, the science research grants from the China Manned Space Project with CMS-CSST-2021-A03 and Cyrus Chun Ying Tang Foundations. AS is also supported by Atracción de Talento Contract no. 2020-T1/TIC19882 granted by the Comunidad de Madrid in Spain. The authors acknowledge The Red Española de Supercomputación for granting computing time for running the hydrodynamical and DMO simulations of THE THREE HUNDRED galaxy cluster project in the Marenostrum supercomputer at the Barcelona Supercomputing Centre and Cibeles Supercomputers through various RES grants. The authors also acknowledge the Gauss Centre for Supercomputing e.V. (https://www.gauss-centre.eu/) for funding this project (pn36si) by providing computing time on the GCS Supercomputer SuperMUC-NG at Leibniz Supercomputing Centre (https://www.lrz.de/).
References
- Ahoranta, J., Nevalainen, J., Wijers, N., et al. 2020, A&A, 634, A106 [NASA ADS] [CrossRef] [EDP Sciences] [Google Scholar]
- Ahoranta, J., Finoguenov, A., Bonamente, M., et al. 2021, A&A, 656, A107 [NASA ADS] [CrossRef] [EDP Sciences] [Google Scholar]
- Anglés-Alcázar, D., Faucher-Giguère, C.-A., Kereš, D., et al. 2017, MNRAS, 470, 4698 [CrossRef] [Google Scholar]
- Appleby, S., Davé, R., Sorini, D., Cui, W., & Christiansen, J. 2023, MNRAS, 519, 5514 [Google Scholar]
- Battye, R. A., Davies, R. D., & Weller, J. 2004, MNRAS, 355, 1339 [NASA ADS] [CrossRef] [Google Scholar]
- Beck, A. M., Murante, G., Arth, A., et al. 2016, MNRAS, 455, 2110 [Google Scholar]
- Bonamente, M., Mirakhor, M., Lieu, R., & Walker, S. 2022, MNRAS, 514, 416 [NASA ADS] [CrossRef] [Google Scholar]
- Bradley, L., Davé, R., Cui, W., Smith, B., & Sorini, D. 2022, ArXiv e-prints [arXiv:2203.15055] [Google Scholar]
- Bregman, J. N. 2007, ARA&A, 45, 221 [Google Scholar]
- Brunner, H., Liu, T., Lamer, G., et al. 2022, A&A, 661, A1 [NASA ADS] [CrossRef] [EDP Sciences] [Google Scholar]
- Bulbul, E., Liu, A., Kluge, M., et al. 2024, A&A, 685, A106 [NASA ADS] [CrossRef] [EDP Sciences] [Google Scholar]
- Cen, R., & Ostriker, J. P. 1999, ApJ, 514, 1 [NASA ADS] [CrossRef] [Google Scholar]
- Cen, R., Tripp, T. M., Ostriker, J. P., & Jenkins, E. B. 2001, ApJ, 559, L5 [Google Scholar]
- Churazov, E., Khabibullin, I., Lyskova, N., Sunyaev, R., & Bykov, A. M. 2021, A&A, 651, A41 [NASA ADS] [CrossRef] [EDP Sciences] [Google Scholar]
- Churazov, E., Khabibullin, I. I., Dolag, K., Lyskova, N., & Sunyaev, R. A. 2023, MNRAS, 523, 1209 [NASA ADS] [CrossRef] [Google Scholar]
- Cui, W., Power, C., Biffi, V., et al. 2016, MNRAS, 456, 2566 [NASA ADS] [CrossRef] [Google Scholar]
- Cui, W., Knebe, A., Yepes, G., et al. 2018a, MNRAS, 473, 68 [NASA ADS] [CrossRef] [Google Scholar]
- Cui, W., Knebe, A., Yepes, G., et al. 2018b, MNRAS, 480, 2898 [Google Scholar]
- Cui, W., Knebe, A., Libeskind, N. I., et al. 2019, MNRAS, 485, 2367 [Google Scholar]
- Cui, W., Chen, L. B., Gao, B., et al. 2020, Journal of Low Temperature Physics, 199, 502 [NASA ADS] [CrossRef] [Google Scholar]
- Cui, W., Dave, R., Knebe, A., et al. 2022, MNRAS, 514, 977 [NASA ADS] [CrossRef] [Google Scholar]
- Davé, R., Cen, R., Ostriker, J. P., et al. 2001, ApJ, 552, 473 [Google Scholar]
- Davé, R., Thompson, R., & Hopkins, P. F. 2016, MNRAS, 462, 3265 [Google Scholar]
- Davé, R., Anglés-Alcázar, D., Narayanan, D., et al. 2019, MNRAS, 486, 2827 [Google Scholar]
- de Graaff, A., Cai, Y.-C., Heymans, C., & Peacock, J. A. 2019, A&A, 624, A48 [NASA ADS] [CrossRef] [EDP Sciences] [Google Scholar]
- Ferraro, S., Hill, J. C., Battaglia, N., Liu, J., & Spergel, D. N. 2016, Phys. Rev. D, 94, 123526 [NASA ADS] [CrossRef] [Google Scholar]
- Foster, A. R., & Heuer, K. 2020, Atoms, 8, 49 [NASA ADS] [CrossRef] [Google Scholar]
- Galárraga-Espinosa, D., Aghanim, N., Langer, M., & Tanimura, H. 2021, A&A, 649, A117 [Google Scholar]
- Galárraga-Espinosa, D., Langer, M., & Aghanim, N. 2022, A&A, 661, A115 [NASA ADS] [CrossRef] [EDP Sciences] [Google Scholar]
- Gouin, C., Gallo, S., & Aghanim, N. 2022, A&A, 664, A198 [NASA ADS] [CrossRef] [EDP Sciences] [Google Scholar]
- Gouin, C., Bonamente, M., Galárraga-Espinosa, D., Walker, S., & Mirakhor, M. 2023, A&A, 680, A94 [NASA ADS] [CrossRef] [EDP Sciences] [Google Scholar]
- Holguin Luna, P., Burchett, J. N., Nagai, D., et al. 2024, ArXiv e-prints [arXiv:2411.13551] [Google Scholar]
- Holt, P., Tuominen, T., Nevalainen, J., et al. 2022, MNRAS, 513, 3387 [CrossRef] [Google Scholar]
- Isopi, G., Capalbo, V., Hincks, A. D., et al. 2024, ArXiv e-prints [arXiv:2410.14404] [Google Scholar]
- Klypin, A., Yepes, G., Gottlöber, S., Prada, F., & Heß, S. 2016, MNRAS, 457, 4340 [Google Scholar]
- Knollmann, S. R., & Knebe, A. 2009, ApJS, 182, 608 [Google Scholar]
- Kovács, O. E., Bogdán, Á., Smith, R. K., Kraft, R. P., & Forman, W. R. 2019, ApJ, 872, 83 [NASA ADS] [CrossRef] [Google Scholar]
- Lebeau, T., Ettori, S., Aghanim, N., & Sorce, J. G. 2024, A&A, 689, A19 [NASA ADS] [CrossRef] [EDP Sciences] [Google Scholar]
- Li, Q., Cui, W., Yang, X., et al. 2020, MNRAS, 495, 2930 [Google Scholar]
- Li, R., Wang, H., Mo, H. J., et al. 2022, ApJ, 936, 11 [Google Scholar]
- Li, Q., Cui, W., Yang, X., et al. 2023, MNRAS, 523, 1228 [NASA ADS] [CrossRef] [Google Scholar]
- Liu, A., Bulbul, E., Ghirardini, V., et al. 2022, A&A, 661, A2 [NASA ADS] [CrossRef] [EDP Sciences] [Google Scholar]
- Luo, X., Wang, H., Cui, W., et al. 2024, ApJ, 966, 236 [Google Scholar]
- Lyskova, N., Churazov, E., Khabibullin, I. I., et al. 2023, MNRAS, 525, 898 [NASA ADS] [CrossRef] [Google Scholar]
- Martizzi, D., Vogelsberger, M., Artale, M. C., et al. 2019, MNRAS, 486, 3766 [Google Scholar]
- McCall, H., Reiprich, T. H., Veronica, A., et al. 2024, A&A, 689, A113 [NASA ADS] [CrossRef] [EDP Sciences] [Google Scholar]
- Merloni, A., Lamer, G., Liu, T., et al. 2024, A&A, 682, A34 [NASA ADS] [CrossRef] [EDP Sciences] [Google Scholar]
- Mirakhor, M. S., & Walker, S. A. 2020, MNRAS, 497, 3204 [Google Scholar]
- Nicastro, F., Kaastra, J., Krongold, Y., et al. 2018, Nature, 558, 406 [Google Scholar]
- Oppenheimer, B. D., Crain, R. A., Schaye, J., et al. 2016, MNRAS, 460, 2157 [NASA ADS] [CrossRef] [Google Scholar]
- Pachat, S., Narayanan, A., Muzahid, S., et al. 2016, MNRAS, 458, 733 [NASA ADS] [CrossRef] [Google Scholar]
- Parimbelli, G., Branchini, E., Viel, M., Villaescusa-Navarro, F., & ZuHone, J. 2023, MNRAS, 523, 2263 [NASA ADS] [CrossRef] [Google Scholar]
- Planck Collaboration I. 2020, A&A, 641, A1 [NASA ADS] [CrossRef] [EDP Sciences] [Google Scholar]
- Planck Collaboration XIII. 2016, A&A, 594, A13 [NASA ADS] [CrossRef] [EDP Sciences] [Google Scholar]
- Popesso, P., Marini, I., Dolag, K., et al. 2024, arXiv e-prints [arXiv:2411.16546] [Google Scholar]
- Rasia, E., Borgani, S., Murante, G., et al. 2015, ApJ, 813, L17 [Google Scholar]
- Rauch, M. 1998, ARA&A, 36, 267 [Google Scholar]
- Reiprich, T. H., Veronica, A., Pacaud, F., et al. 2021, A&A, 647, A2 [EDP Sciences] [Google Scholar]
- Shull, J. M., Smith, B. D., & Danforth, C. W. 2012, ApJ, 759, 23 [NASA ADS] [CrossRef] [Google Scholar]
- Smith, B. D., Bryan, G. L., Glover, S. C. O., et al. 2017, MNRAS, 466, 2217 [NASA ADS] [CrossRef] [Google Scholar]
- Sorini, D., Davé, R., Cui, W., & Appleby, S. 2022, MNRAS, 516, 883 [CrossRef] [Google Scholar]
- Springel, V. 2005, MNRAS, 364, 1105 [Google Scholar]
- Springel, V., & Hernquist, L. 2003, MNRAS, 339, 289 [Google Scholar]
- Štofanová, L., Simionescu, A., Wijers, N. A., et al. 2024, MNRAS, 527, 5776 [Google Scholar]
- Sunyaev, R. A., & Zeldovich, Y. B. 1972, Comm. Astrophys. Space Phys., 4, 173 [Google Scholar]
- Tanimura, H., Hinshaw, G., McCarthy, I. G., et al. 2019, MNRAS, 483, 223 [Google Scholar]
- Tanimura, H., Aghanim, N., Bonjean, V., Malavasi, N., & Douspis, M. 2020, A&A, 637, A41 [NASA ADS] [CrossRef] [EDP Sciences] [Google Scholar]
- Tanimura, H., Aghanim, N., Douspis, M., & Malavasi, N. 2022, A&A, 667, A161 [NASA ADS] [CrossRef] [EDP Sciences] [Google Scholar]
- Tepper-García, T., Richter, P., Schaye, J., et al. 2011, MNRAS, 413, 190 [Google Scholar]
- Tripp, T. M., Sembach, K. R., Bowen, D. V., et al. 2008, ApJS, 177, 39 [NASA ADS] [CrossRef] [Google Scholar]
- Tuominen, T., Nevalainen, J., Tempel, E., et al. 2021, A&A, 646, A156 [EDP Sciences] [Google Scholar]
- Ursino, E., Branchini, E., Galeazzi, M., et al. 2011, MNRAS, 414, 2970 [NASA ADS] [CrossRef] [Google Scholar]
- Veronica, A., Reiprich, T. H., Pacaud, F., et al. 2024, A&A, 694, A168 [Google Scholar]
- Wiersma, R. P. C., Schaye, J., & Smith, B. D. 2009, MNRAS, 393, 99 [NASA ADS] [CrossRef] [Google Scholar]
- Yang, T., Davé, R., Cui, W., et al. 2024, MNRAS, 527, 1612 [Google Scholar]
- Zhang, X., Bulbul, E., Malavasi, N., et al. 2024a, A&A, 691, A234 [NASA ADS] [CrossRef] [EDP Sciences] [Google Scholar]
- Zhang, Y., Comparat, J., Ponti, G., et al. 2024b, A&A, 690, A267 [NASA ADS] [CrossRef] [EDP Sciences] [Google Scholar]
- Zhang, M., Walker, K., Sullivan, A., et al. 2025, PASA, 42, e008 [Google Scholar]
- Zhao, Y., Xu, H., Liu, A., et al. 2025, A&A, 695, A15 [NASA ADS] [CrossRef] [EDP Sciences] [Google Scholar]
All Figures
|
Fig. 1. Temperature distribution of GIZMO-SIMBA (colour-filled contours) and GADGET-X (contour lines). The left panel shows the temperature distribution of all gas as a function of normalised radius from the cluster centres, while the right panel presents the corresponding temperature profiles. In the left panel, contour lines enclose 20%, 50%, 80%, 95%, and 99% of gas particles within the analysis region, with 2D radii normalised to R200c. Horizontal dashed lines indicate the warm-hot temperature range, defined between 105 K and 107 K. The right panel displays median temperature profiles of all 324 clusters with different line colours for different halo mass removal thresholds as indicated in the legend. The error bars for GIZMO and shadow regions for GadgetX show the 20–80 percentiles of all profiles. Only the results from all gas and the halo mass threshold of 1e13.5 M⊙/h are displayed here. |
| In the text | |
|
Fig. 2. Left panel: Similar to Figure 1, but for the density distribution of all the gas particles for GIZMO-SIMBA (colour-filled contours) and GADGET-X (contours). The contour lines enclose 20%, 50%, 80%, 95%, and 99% of gas particles within the analysis region, with 2D radii normalised to R200c. The two black contours indicate the region on this plane that encloses 50% of the WHIM gas in each simulation. Right panel: Radial profile of the fraction of gas that is WHIM. Coloured lines show different halo mass removal thresholds as indicated in the legend. |
| In the text | |
|
Fig. 3. Similar to the right panel of Figure 1, but showing temperature profiles at different redshifts with all halos included. Line styles indicate the simulation type, while colours represent different redshifts. All the profiles show the median temperature of all 324 clusters. In general, gas outside the clusters is cooler in GADGET-X than in GIZMO-SIMBA, particularly at large radii. The 20% and 80% percentiles are shown with error bars for GIZMO and shaded regions for GadgetX. Again, these error bars are shown only for z = 0 and z = 0.5 results. |
| In the text | |
|
Fig. 4. Radial surface density profiles of warm gas (top) and the fraction of warm gas relative to all gas (bottom). Line styles indicate the simulation type, while colours represent different redshifts. We note that no halos have been removed. |
| In the text | |
|
Fig. 5. Stacked 0.2 ∼ 2.3 keV X-ray surface brightness maps for GIZMO-SIMBA (left) and GADGET-X (right). The top panels display X-ray emission from only WHIM gas with halos more massive than 1013.5 M⊙/h removed. The middle panels show X-ray emission from all gas particles with the same halos, M200c > 1013.5 M⊙/h, removed. The bottom panels present X-ray emission also from all gas particles, but without removing halos. |
| In the text | |
|
Fig. 6. X-ray surface brightness profile of the total gas obtained via the stacking method (top) and the fractional contribution of the X-ray signal from warm-hot gas (bottom). Line styles represent different simulations, while colours indicate halo removal thresholds. Thickened lines correspond to the removal of halos above 1013.5 M⊙/h. |
| In the text | |
|
Fig. 7. op panel: Stacked X-ray surface brightness profiles of total gas for GIZMO-SIMBA and GADGET-X at various redshifts. Bottom panel: WHIM contribution ratios. Halos above 1013.5 M⊙/h have been removed. Green plus symbols (+) represent the Coma cluster surface brightness profile in the 0.4–2 keV band from Churazov et al. (2021). The blue Xs indicate the stacked X-ray profile of clusters at redshifts 0.05–0.2 in the 0.3–2.3 keV band from Lyskova et al. (2023). |
| In the text | |
|
Fig. 8. Average flux between 2R200c and 3R200c outside central clusters as a function of redshift, along with their 5σ significance thresholds (top panel). The result was obtained by removing all halos above 1013.5 M⊙/h. The bottom panel shows the required number of clusters to achieve a 5σ detection as a function of expansion factor, a. The corresponding redshift is indicated along the top. These results are based on eROSITA observational systematics and assume an exposure time of 100s. |
| In the text | |
Current usage metrics show cumulative count of Article Views (full-text article views including HTML views, PDF and ePub downloads, according to the available data) and Abstracts Views on Vision4Press platform.
Data correspond to usage on the plateform after 2015. The current usage metrics is available 48-96 hours after online publication and is updated daily on week days.
Initial download of the metrics may take a while.