Fig. 3.
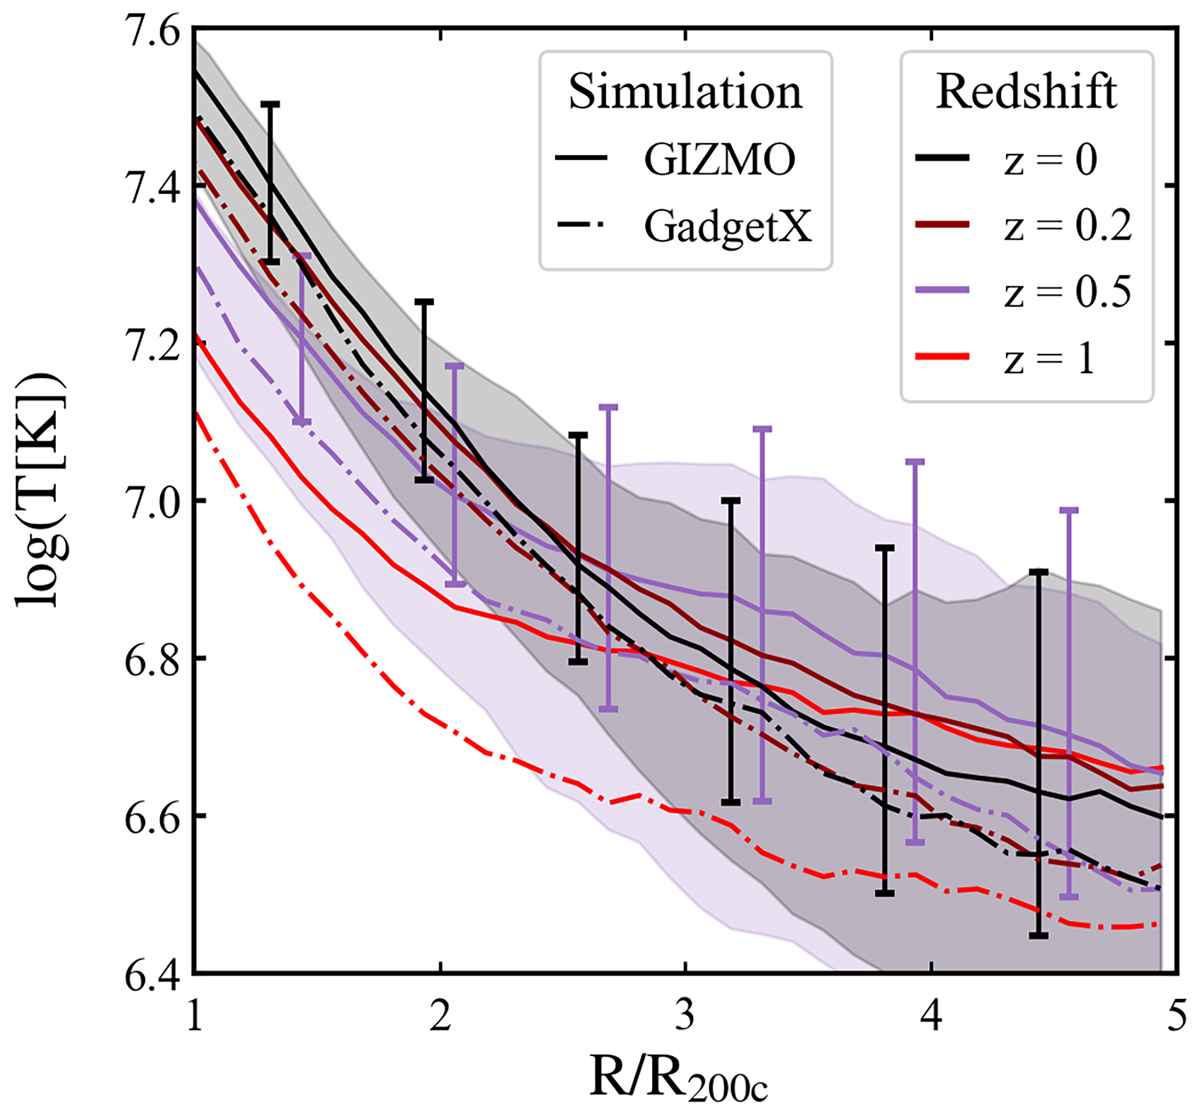
Download original image
Similar to the right panel of Figure 1, but showing temperature profiles at different redshifts with all halos included. Line styles indicate the simulation type, while colours represent different redshifts. All the profiles show the median temperature of all 324 clusters. In general, gas outside the clusters is cooler in GADGET-X than in GIZMO-SIMBA, particularly at large radii. The 20% and 80% percentiles are shown with error bars for GIZMO and shaded regions for GadgetX. Again, these error bars are shown only for z = 0 and z = 0.5 results.
Current usage metrics show cumulative count of Article Views (full-text article views including HTML views, PDF and ePub downloads, according to the available data) and Abstracts Views on Vision4Press platform.
Data correspond to usage on the plateform after 2015. The current usage metrics is available 48-96 hours after online publication and is updated daily on week days.
Initial download of the metrics may take a while.