Open Access
Fig. 1
Download original image
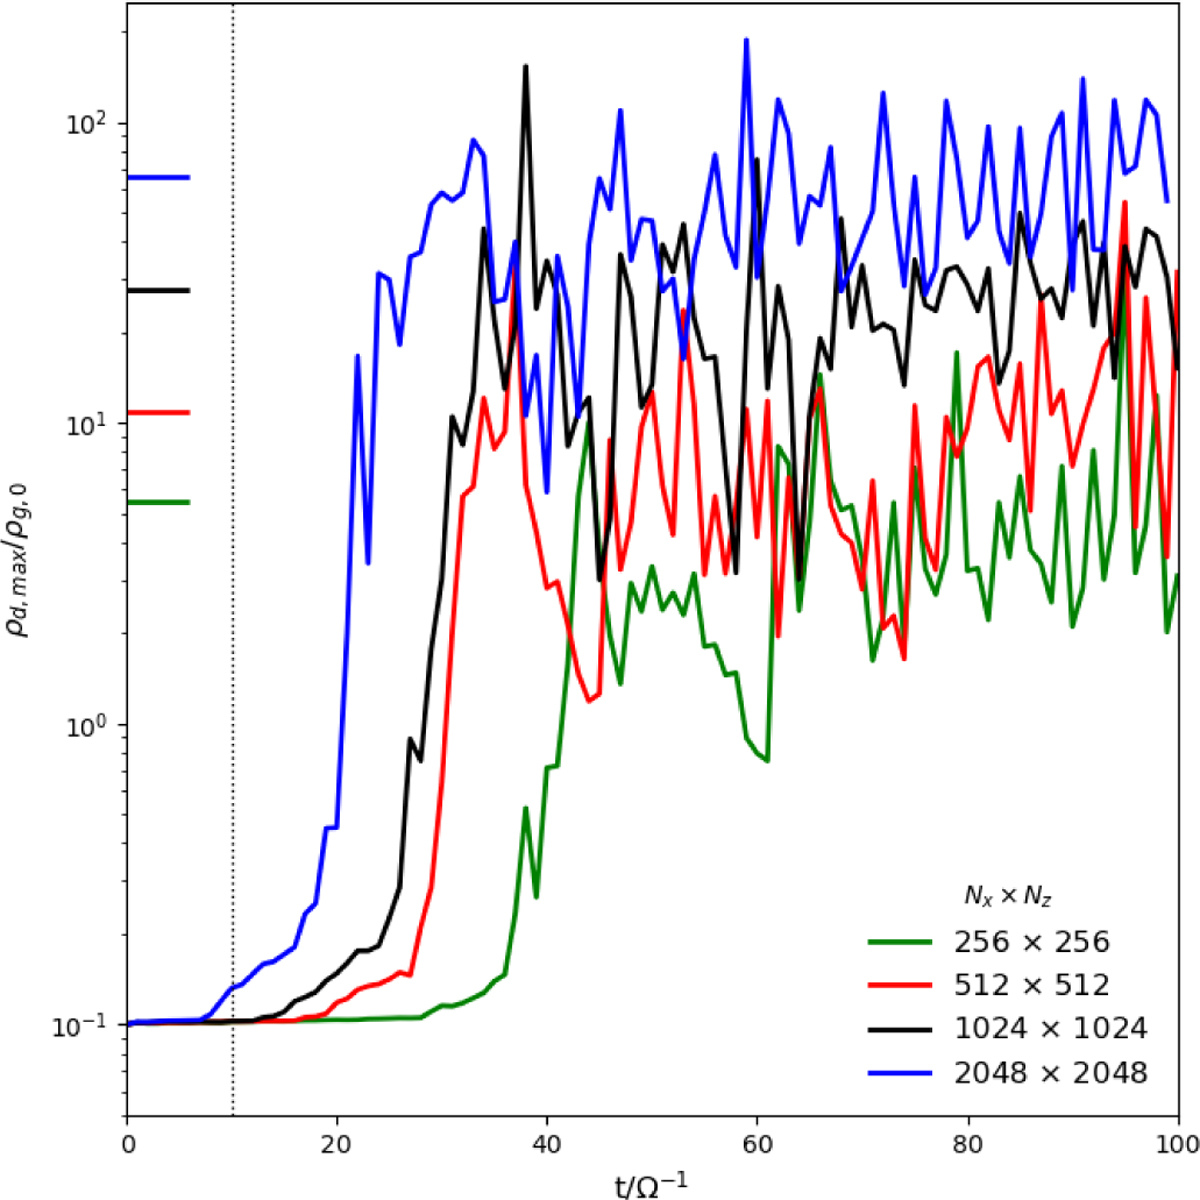
Evolution of the maximum dust density with time for the monodisperse settling instability with four different resolutions (run1 to run4 in Table 1). Short horizontal lines on the left indicate averages between 60 and 100Ω−1 and the vertical dotted line indicates the settling time.
Current usage metrics show cumulative count of Article Views (full-text article views including HTML views, PDF and ePub downloads, according to the available data) and Abstracts Views on Vision4Press platform.
Data correspond to usage on the plateform after 2015. The current usage metrics is available 48-96 hours after online publication and is updated daily on week days.
Initial download of the metrics may take a while.