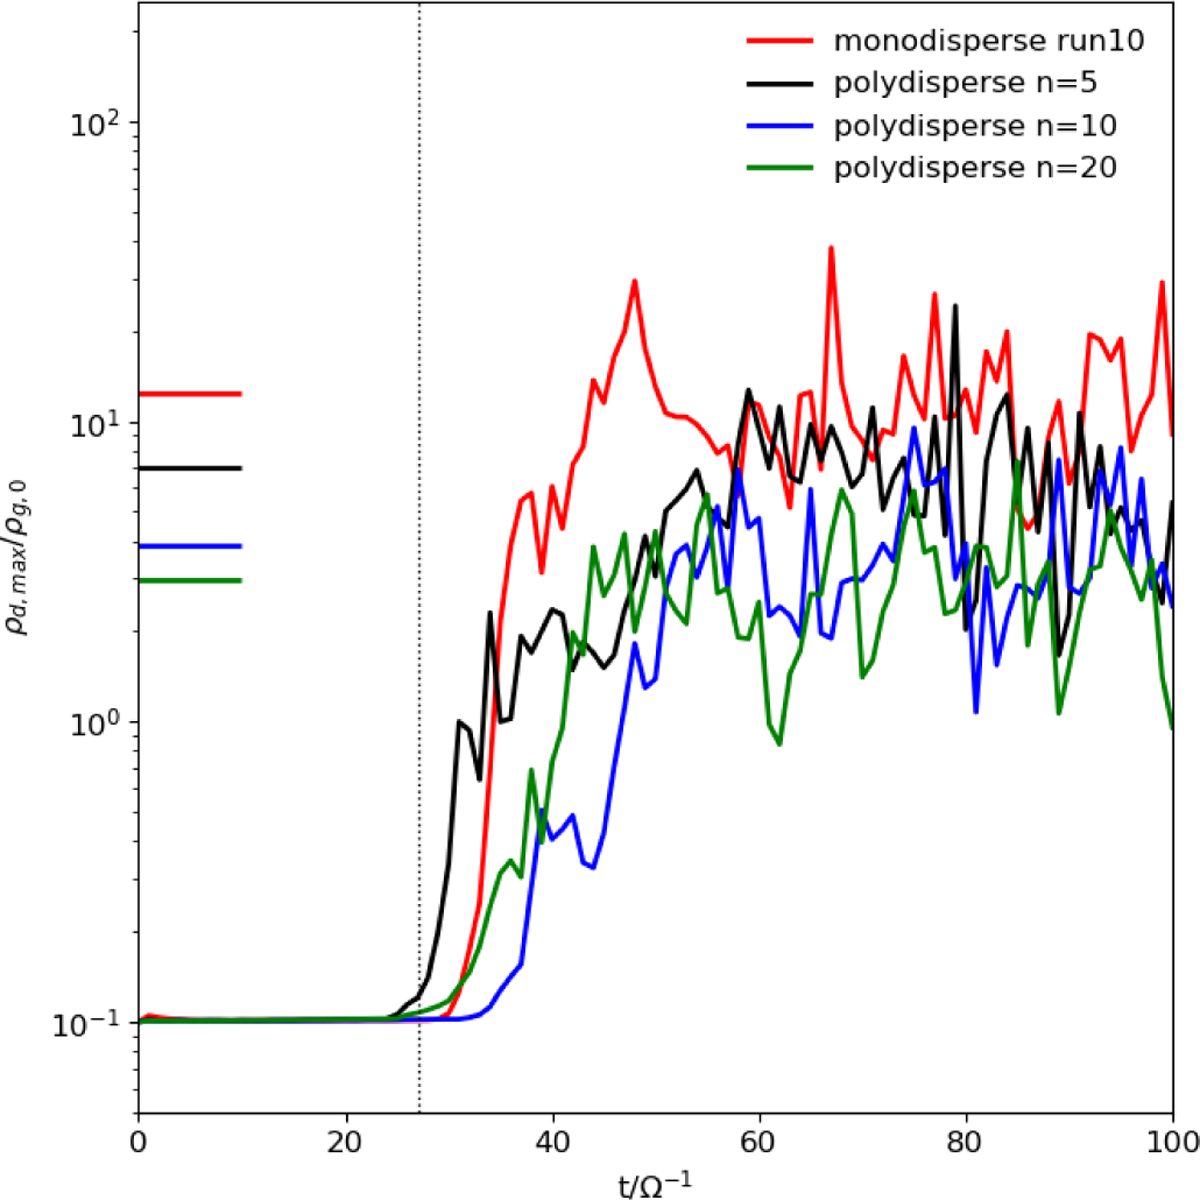
Fig. 5
Download original image
Evolution of maximum (total) dust density with time for three polydisperse simulations with n = 5, 10, and 20, as well as the monodisperse run10. The short horizontal lines to the left indicate averages between 60 and 100Ω−1 and the vertical dotted line indicates the settling time for the monodisperse run10 (with a stopping time τs = 0.037 equivalent to the average stopping time of the polydisperse runs).
Current usage metrics show cumulative count of Article Views (full-text article views including HTML views, PDF and ePub downloads, according to the available data) and Abstracts Views on Vision4Press platform.
Data correspond to usage on the plateform after 2015. The current usage metrics is available 48-96 hours after online publication and is updated daily on week days.
Initial download of the metrics may take a while.