Open Access
Fig. 9
Download original image
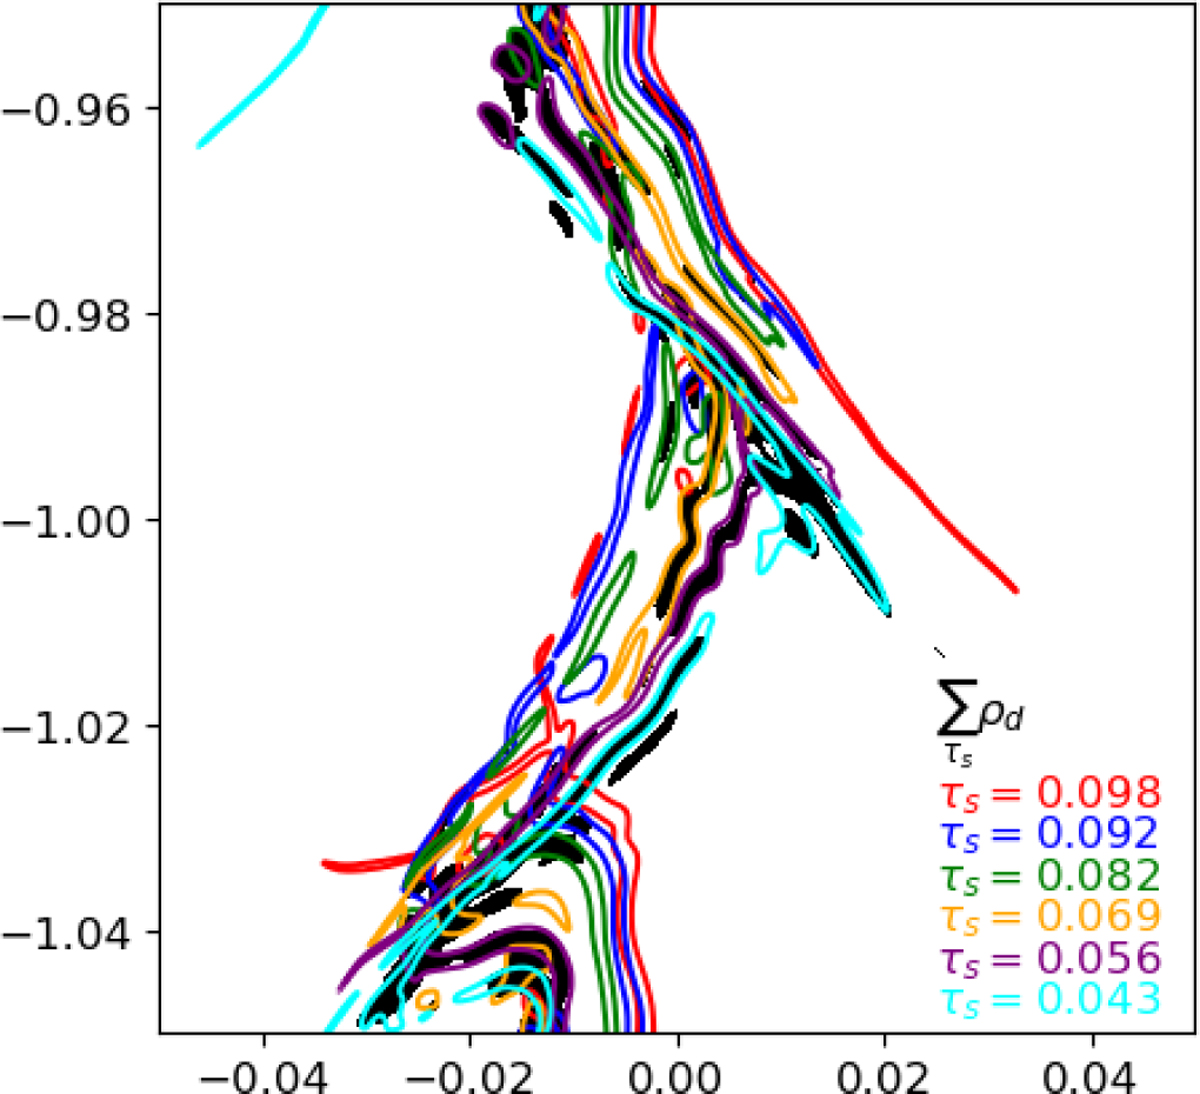
Coloured open curves represent contours of the top 2% density for the highest six stopping times (see figure legend) for the same snapshot shown in Figure 8. The filled black curve represents the top 5% total density of the sum of all 20 species.
Current usage metrics show cumulative count of Article Views (full-text article views including HTML views, PDF and ePub downloads, according to the available data) and Abstracts Views on Vision4Press platform.
Data correspond to usage on the plateform after 2015. The current usage metrics is available 48-96 hours after online publication and is updated daily on week days.
Initial download of the metrics may take a while.